Climate change and risks for Australian cultural collections
Maps and Workflows Resource
AUTHORS
Amanda Pagliarino amanda.pagliarino@qagoma.qld.gov.au
Ainslee Meredith ainslee.meredith@gmail.com
In 2020, Amanda Pagliarino and Ainslee Meredith published the climate projection and cultural heritage paper, Mapping climate change and risks for Australian cultural collections (AICCM Bulletin, Vol. 41/1, pp. 3-26).
In this paper the climate change variables of temperature, relative humidity, rainfall and fire weather are used in conjunction with spatial methodologies to produce maps that overlay locations of Australian national, state and regional cultural heritage collections with climate change risks. Three national maps and nine regional maps are published in the paper. The paper also addresses climate-induced changes in the biological risk of insect pests and mould.
The purpose of this wiki Map and Workflow Resource is to provide access to an extensive catalogue of national and regional climate change projection and collection location maps that further support the published paper.
The overlay maps produced as part of this research illustrate potential future climate scenarios at short-term (2030) and long-term (2090) timescales, using two greenhouse gas Representative Concentration Pathways (RCP), at two different emission scenarios corresponding to continued intermediate-level emissions (RCP4.5) and increased high-level emissions (RCP8.5). Mid-term (2050) projections and maps are addressed in the AICCM Bulletin paper however the authors chose not to include mid-term resources due to the large number of maps that needed to be produced.
MAPS
180 national and regional maps showing surface and maximum daily temperatures and long-term humidity climate change projections have been uploaded to this wiki resource. The maps are ordered alphabetically by geographic location. Each location is represented by the two emission pathways – RCP4.5 and RCP8.5 and the two timescales – short-term and long-term.
RESEARCH METHODOLOGY
For a full description of the research and mapping methodology please refer to Pagliarino, A and Meredith, A 2020, Mapping climate change and risks for Australian cultural collections, AICCM Bulletin, Vol. 41/1, pp. 3-26.
Collection type datasets used in this research include (i) national and state-owned collections and (ii) regional art galleries associated with local councils.
GLOSSARY
Definitions have been drawn from the Intergovernmental Panel on Climate Change (IPCC) website and the Australian Bureau of Meteorology website.
Annual average near-surface relative humidity – The average daily relative humidity measured at a given distance from the ground for each month and as an annual statistic, calculated over all years of record.
Annual maximum daily temperature – The average daily maximum air temperature for each month and as an annual statistic, calculated over all years of record.
Annual mean surface temperature – The average daily temperature measured just above the surface of the ground for each month and as an annual statistic, calculated over all years of record.
Radiative forcing – The measure of the influence of climatic factors on the radiant energy directed towards the earth’s surface. This is a measure defined by the IPCC.
Representative Concentration Pathways (RCP) – Scenarios that include time series of emissions and concentrations of the full suite of greenhouse gases, aerosols and chemically active gases, as well as land use / land cover. The word representative signifies that each RCP provides only one of many possible scenarios that would lead to the specific radiative forcing characteristics. The term pathway encompasses the long-term concentration levels and the trajectory taken over time to reach that outcome.
RCP4.5 – An intermediate scenario in which greenhouse gas emissions peak around 2040 and then decline.
RCP8.5 – A greenhouse gas emissions scenario that sees continued rise throughout the 21st century. This scenario is thought to be less likely, however it remains a useful reference point because climate change is part of dynamic and complex systems and the rate of warming, and systems response and feedback is not yet fully understood.
Statement for the interpretation of maps including explanatory notes and legends
Maps were created to show the potential impact of factors associated with climate change on collections in various locations across Australia.
Climate change projections developed by the international scientific community show predicted changes to three variables: mean surface temperature (°C); average maximum annual daily temperature (°C); and relative humidity (RH). Two time periods are shown on the maps, corresponding to the short-term future (2030) and long-term future (2090). Each time period was analysed at two RCPs: RCP4.5, to simulate intermediate levels of emissions, and RCP8.5, to simulate high emissions. The climate model applied in this study is the ACCESS1-0 model, produced by CSIRO and the Bureau of Meteorology as part of the Coupled Model Intercomparison Project phase 5. Please refer to the published paper for a full methodology.
Two sets of collections were mapped: (a) national, state and territory collections run by the Commonwealth and state and territory governments; and (b) regional art galleries associated with local councils. No regional maps were created for the Australian Capital Territory and the Northern Territory, as there are no municipal councils in the ACT, and no regional art galleries linked to local councils in the NT that could be identified by the authors. Maps of collections in Queensland are split into northern and southern area maps to enable detail to be shown.
Collection location data was compiled in 2019 and reflects the data available at the time. There is the chance that some collections have moved, changed names or closed, or that new collections may have opened since that are not included on these maps.
- Climate Adaptation
- Sustainable Collections
- Sustainable Collections - 01
- Sustainable Collections - 02 - Greening
- Sustainable Collections - 03 - Resourcing
- Sustainable Collections - 04 - Preservation Environments
- Sustainable Collections - 05 - Access and Engagement
- Sustainable Collections - 06 - Horizon Scanning
AUSTRALIA
2030 scenarios
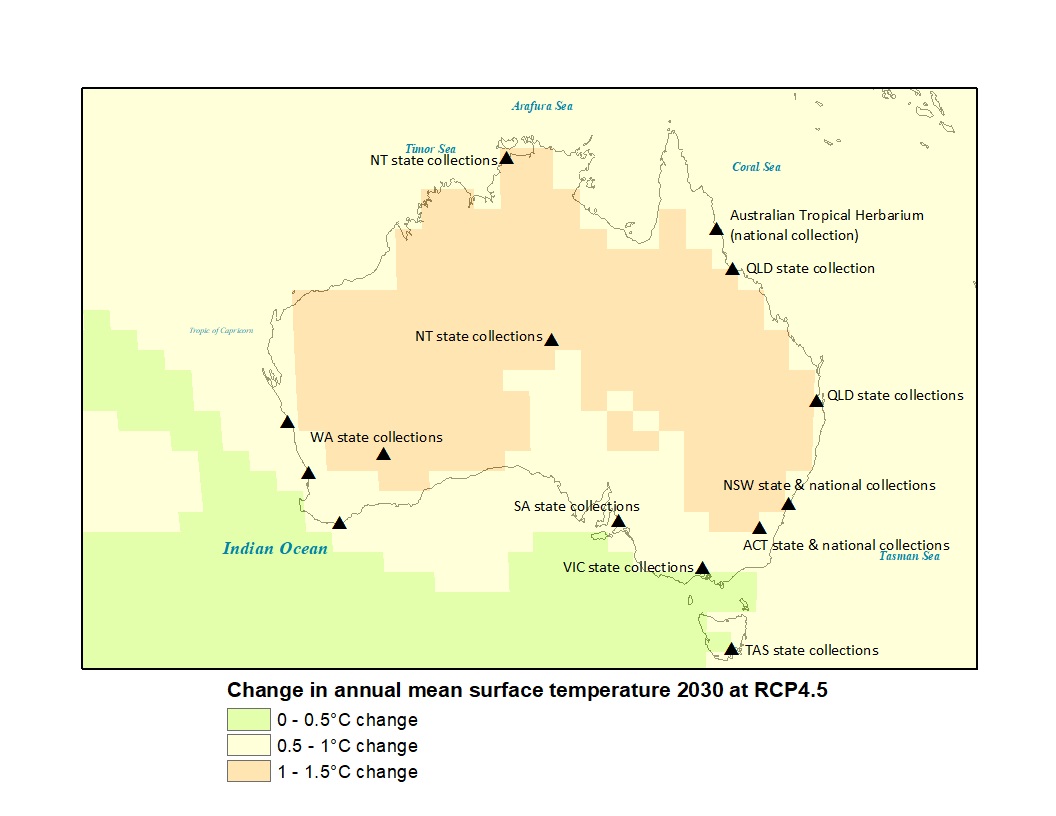
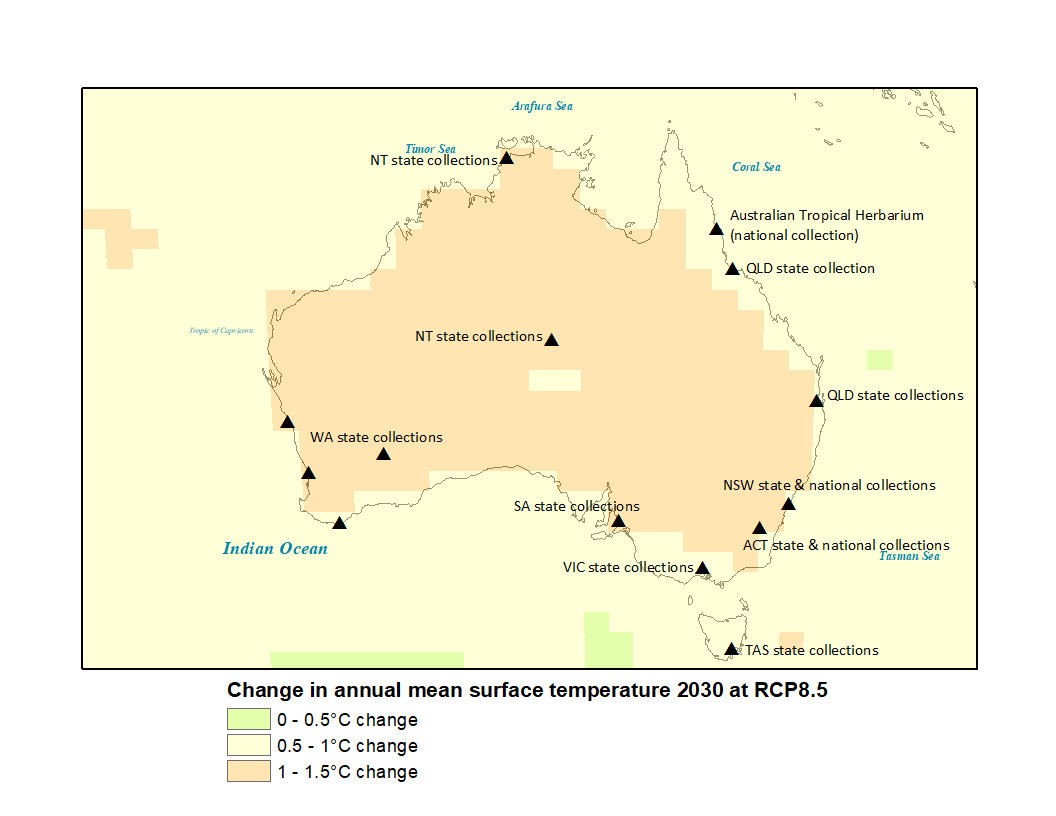
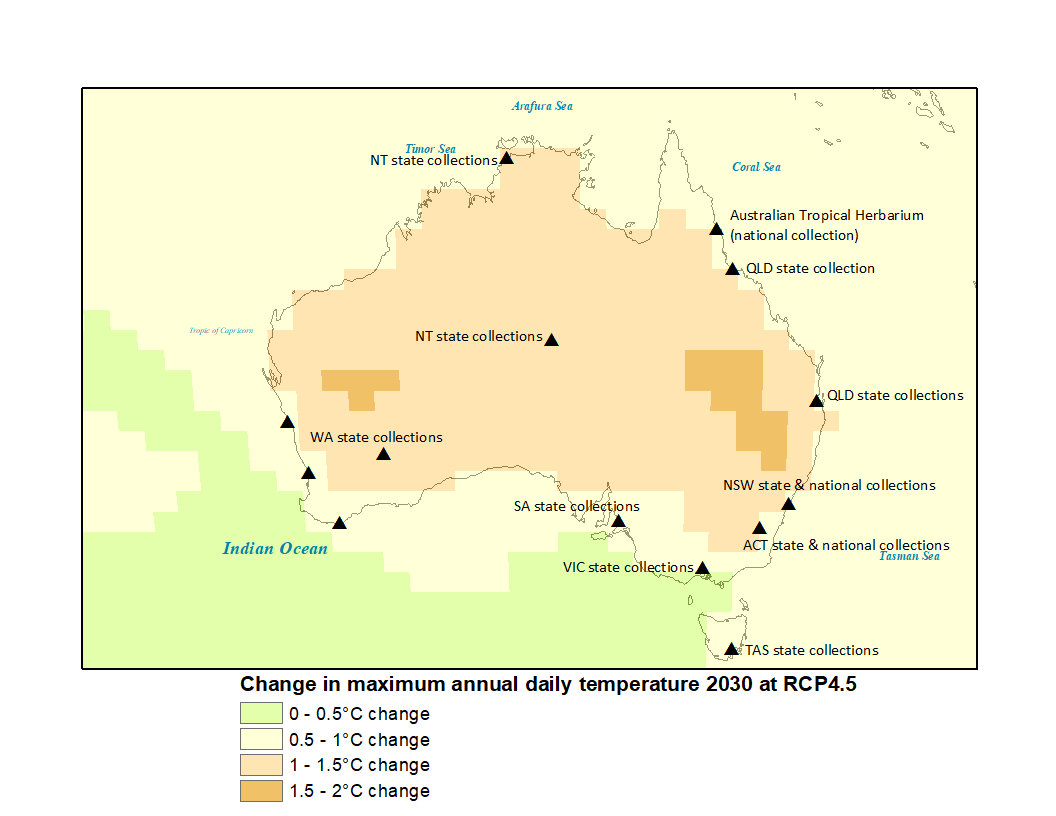
Climate projection data provided by CSIRO and Bureau of Meteorology, Climate Change in Australia website (http://www.climatechangeinaustralia.gov.au/), cited 5 November 2019. Also shown are Australia’s national, state and territory collection locations. See Table 1 legend for additional map locations.
Map A1.1.
Map showing changes to the annual mean surface temperature by the year 2030 under scenario RCP4.5
Map A1.2.
Map showing changes to the annual mean surface temperature by the year 2030 under scenario RCP8.5
Map A2.1.
Map showing changes to the maximum annual daily temperature by the year 2030 under scenario RCP4.5

Map A2.2.
Map showing changes to the maximum annual daily temperature by the year 2030 under scenario RCP8.5

2090 scenarios
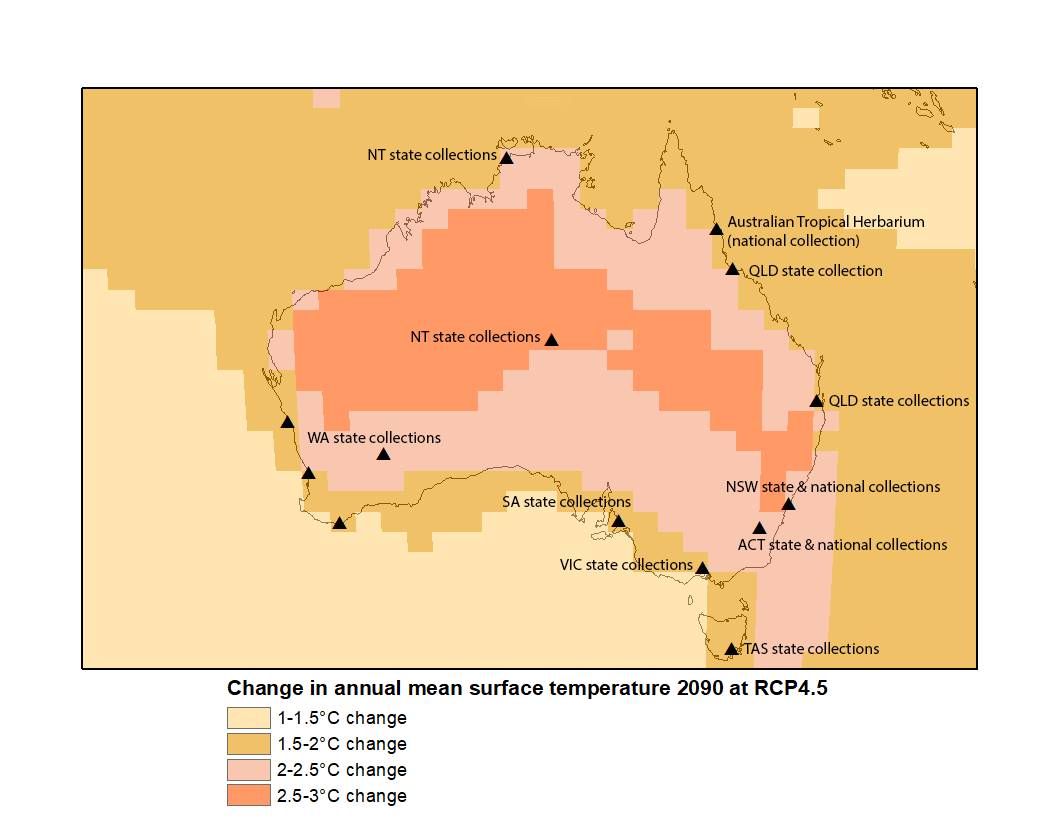
Climate projection data provided by CSIRO and Bureau of Meteorology, Climate Change in Australia website (http://www.climatechangeinaustralia.gov.au/), cited 5 November 2019. Also shown are Australia’s national, state and territory collection locations. See Table 1 legend for additional map locations. *Maps A1.5 and A1.6 first published as Figure 2 and Figure 3 in Pagliarino & Meredith 2020, AICCM Bulletin.
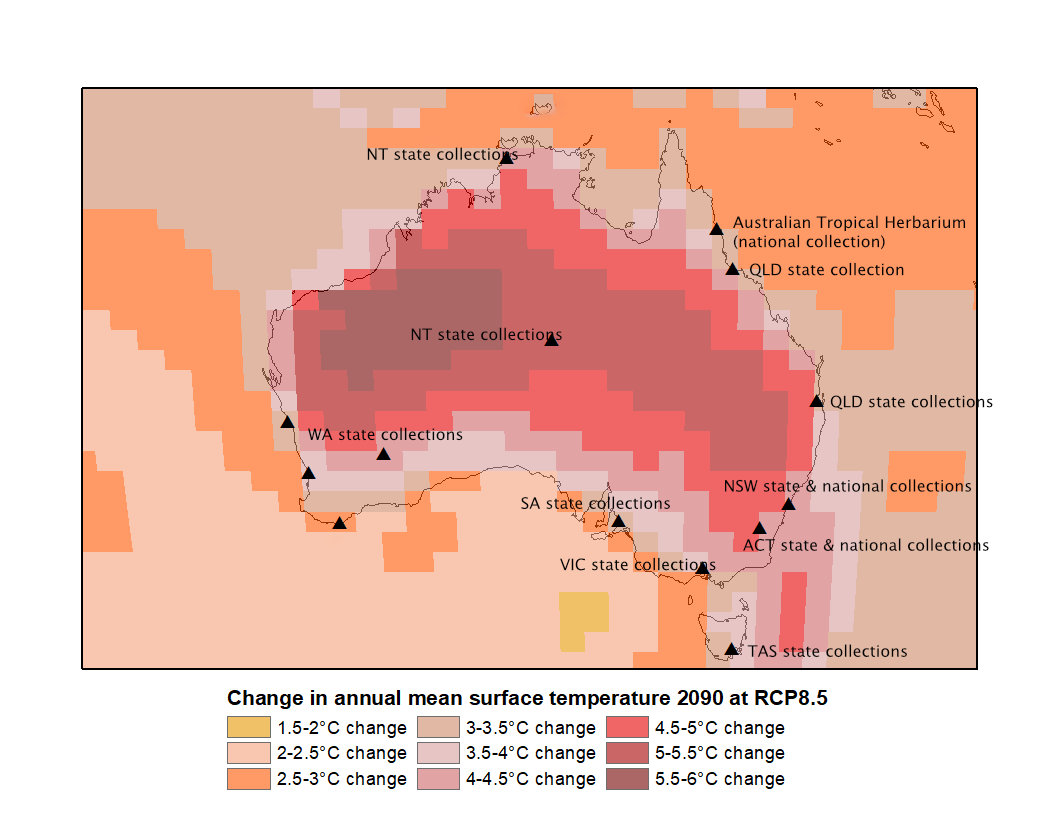
Map A1.5.
Map showing changes to the annual mean surface temperature by the year 2090 under scenario RCP4.5
Map A1.6.
Map showing changes to the annual mean surface temperature by the year 2090 under scenario RCP8.5
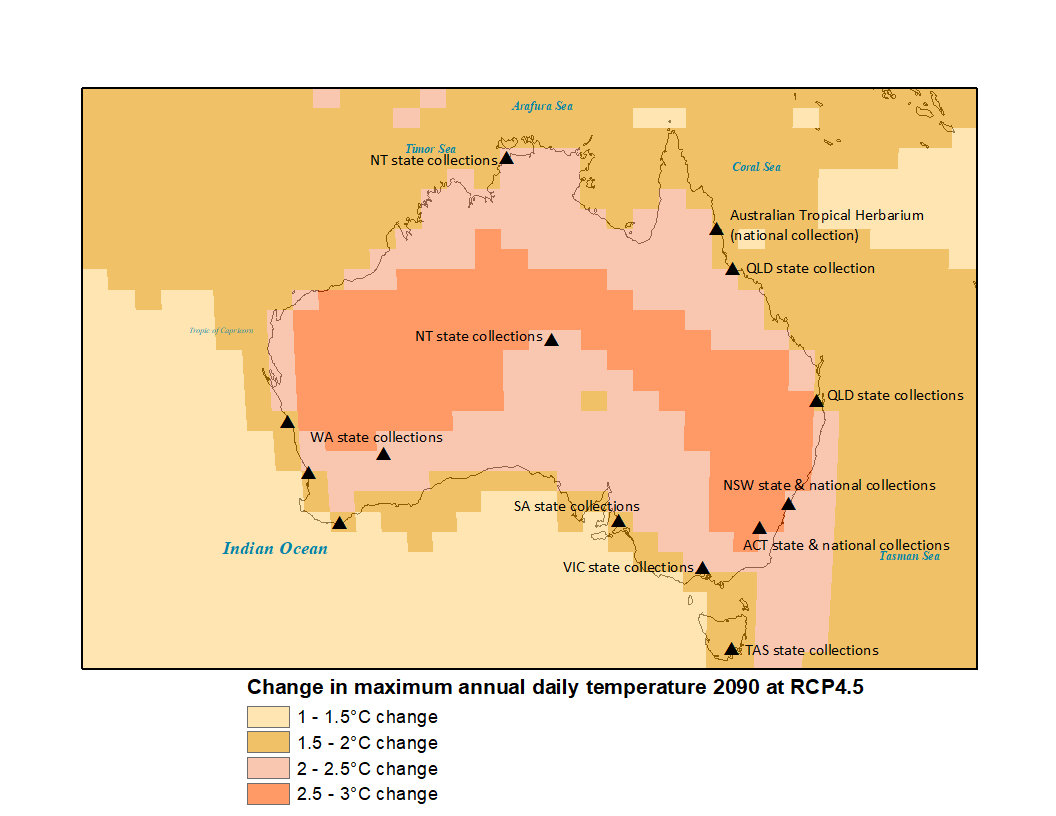
Map A2.5.
Map showing changes to the maximum annual daily temperature by the year 2090 under scenario RCP4.5
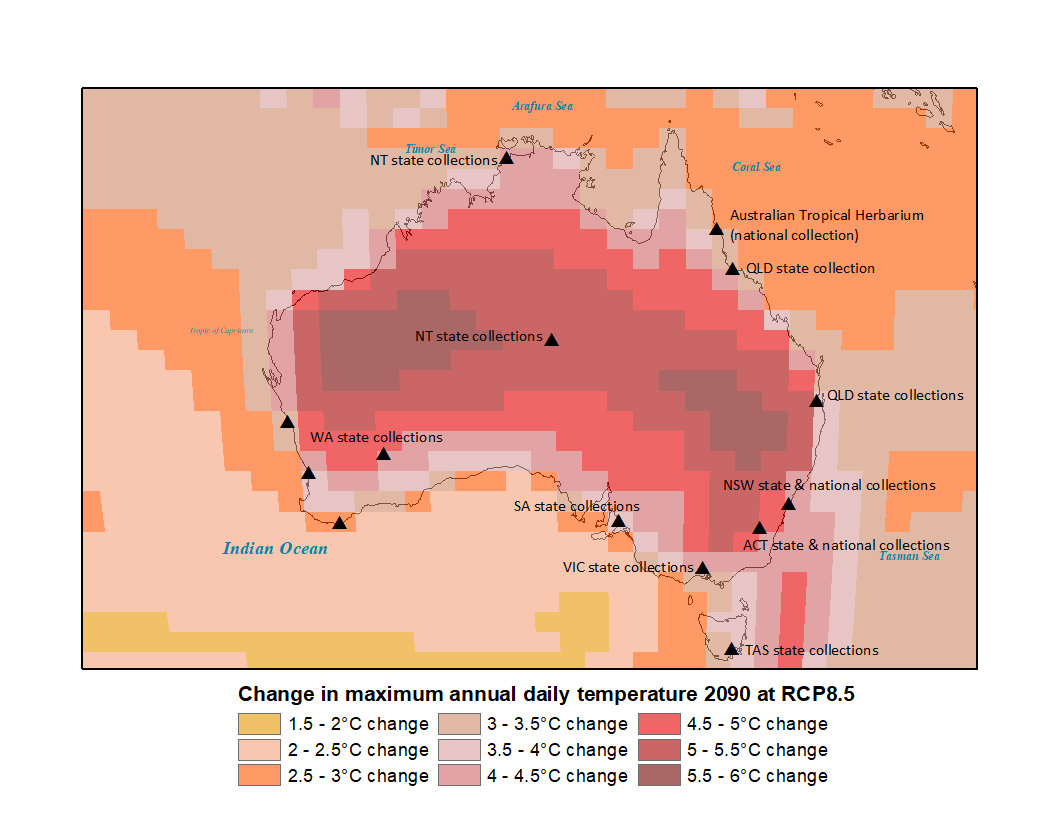
Map A2.6.
Map showing changes to the maximum annual daily temperature by the year 2090 under scenario RCP8.5
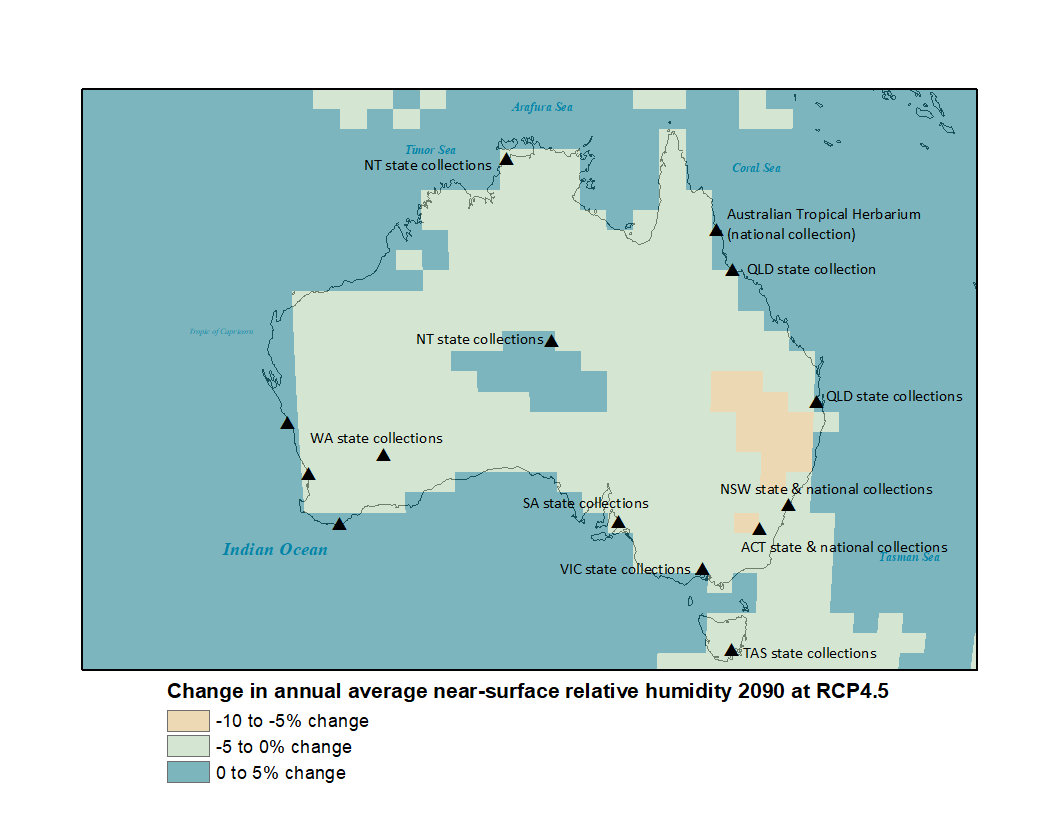
Map A3.5.
Map showing changes to the annual average near-surface relative humidity by the year 2090 under scenario RCP4.5
Map A3.6.
Map showing changes to the annual average near-surface relative humidity by the year 2090 under scenario RCP8.5
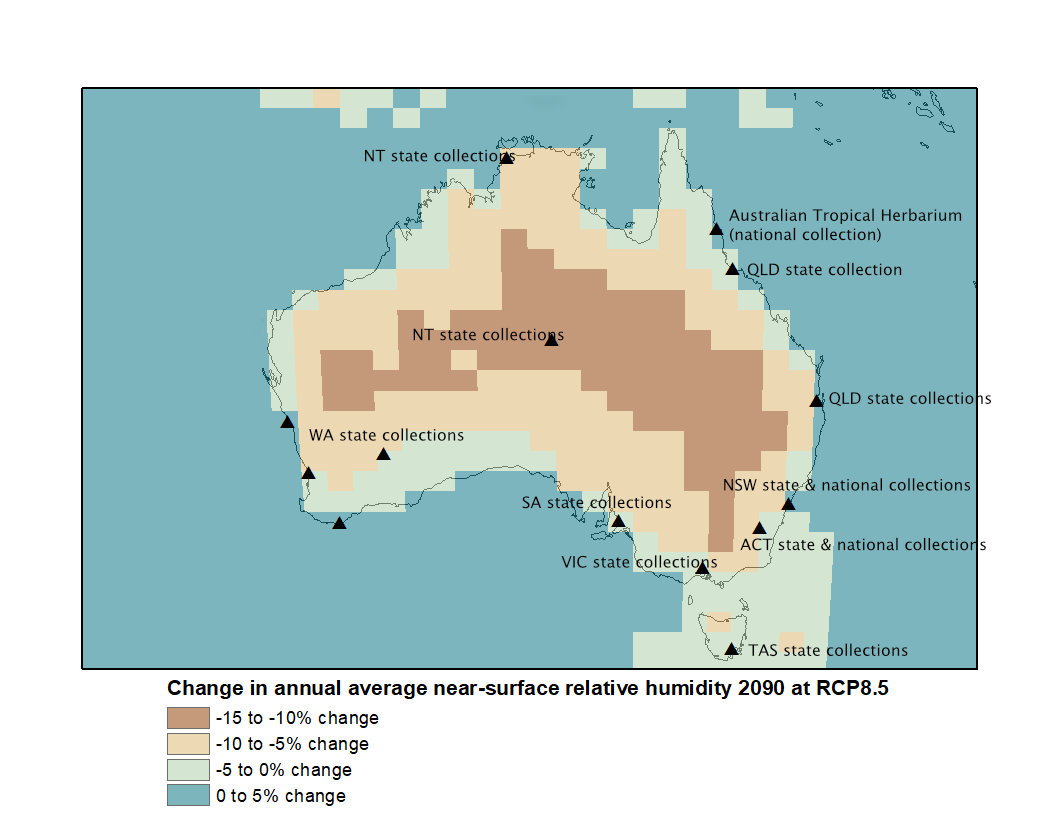
Table 1. Legend of additional locations in maps A1.1, A1.2, A1.5, A1.6, A2.1, A2.2, A2.5, A2.6, A3.5 and A3.6
| QLD state collections | Cobb & Co Museum Museum of Tropical Queensland Queensland Art Gallery & Gallery of Modern Art Queensland Herbarium Queensland Museum Queensland State Archives State Library of Queensland The Workshops Rail Museum |
| NSW state & national collections | Art Gallery of New South Wales Australian Museum Australian National Maritime Museum Bundanon Trust Powerhouse Museum National Herbarium of NSW NSW State Archives & Records State Library of New South Wales Sydney Living Museums Sydney Opera House |
| ACT state & national collections | ACT Heritage Library AIATSIS Australian National Herbarium Australian War Memorial Canberra Museum and Gallery The Museum of Australian Democracy National Archives of Australia National Film and Sound Archive National Gallery of Australia The National Library of Australia National Museum of Australia National Portrait Gallery Questacon |
| TAS state collections | Archives Office of Tasmania State Library of Tasmania Tasmanian Museum and Art Gallery |
| VIC state collections | Arts Centre Melbourne Australian Centre Moving Image Immigration Museum Melbourne Museum National Gallery of Victoria National Herbarium of Victoria Public Record Office Victoria Scienceworks Museum Shrine of Remembrance State Library of Victoria |
| SA state collections | Art Gallery of South Australia Migration Museum (History SA) National Motor Museum Santos Museum of Economic Botany South Australian Maritime Museum South Australian Museum State Herbarium of South Australia State Library of South Australia State Records of South Australia |
| WA state collections | Art Gallery of WA State Library of WA State Records Office of WA Western Australian Herbarium WA Maritime Museum Western Australian Museum WA Shipwrecks Museum |
| NT state collections | Araluen Arts Centre Museum & Art Gallery of the NT Northern Territory Archives Northern Territory Library |
NEW SOUTH WALES
2030 scenarios
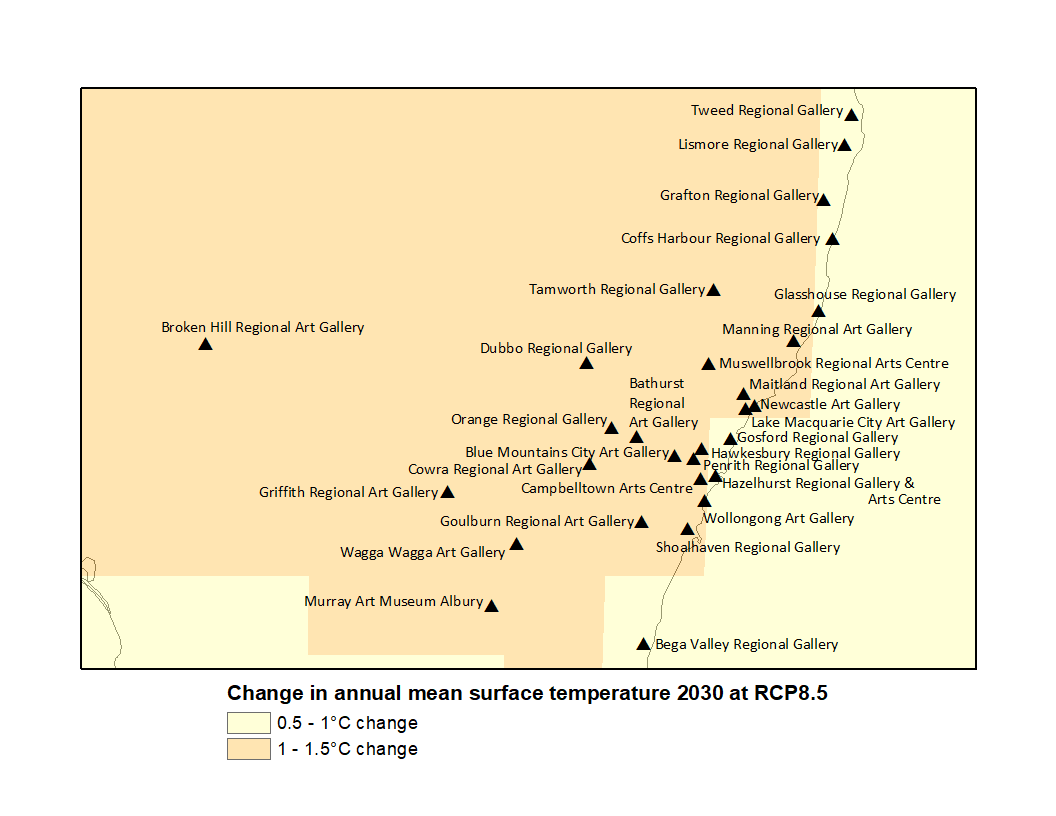
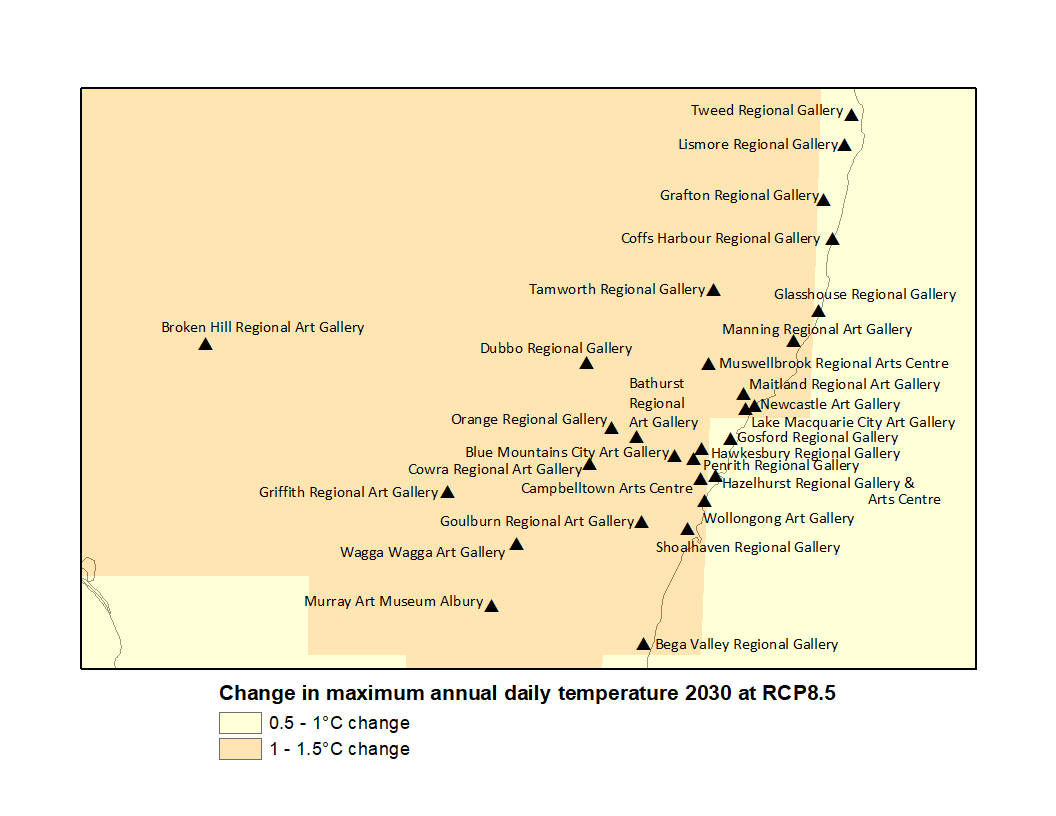
Climate projection data provided by CSIRO and Bureau of Meteorology, Climate Change in Australia website (http://www.climatechangeinaustralia.gov.au/), cited 5 November 2019. Also shown are regional council art galleries in New South Wales.
Map N1.1.
Map showing changes to the annual mean surface temperature by the year 2030 under scenario RCP4.5

Map N1.2.
Map showing changes to the annual mean surface temperature by the year 2030 under scenario RCP8.5
Map N2.1.
Map showing changes to the maximum annual daily temperature by the year 2030 under scenario RCP4.5

Map N2.2.
Map showing changes to the maximum annual daily temperature by the year 2030 under scenario RCP8.5
2090 scenarios
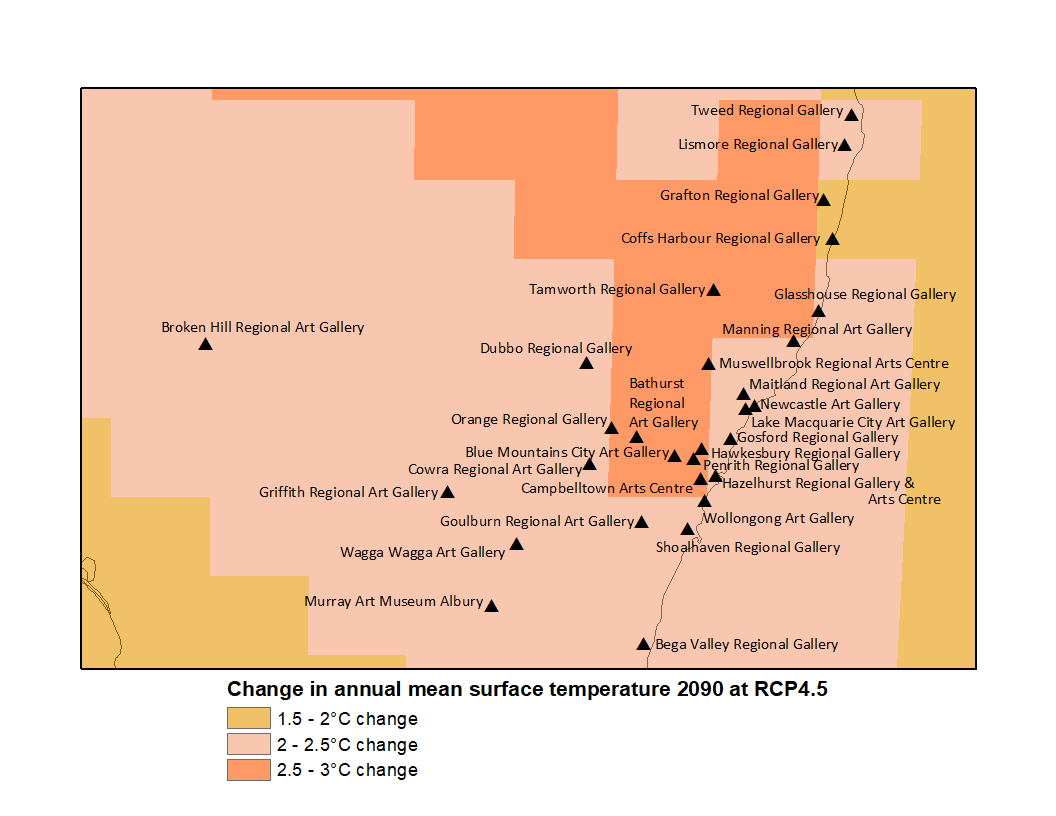
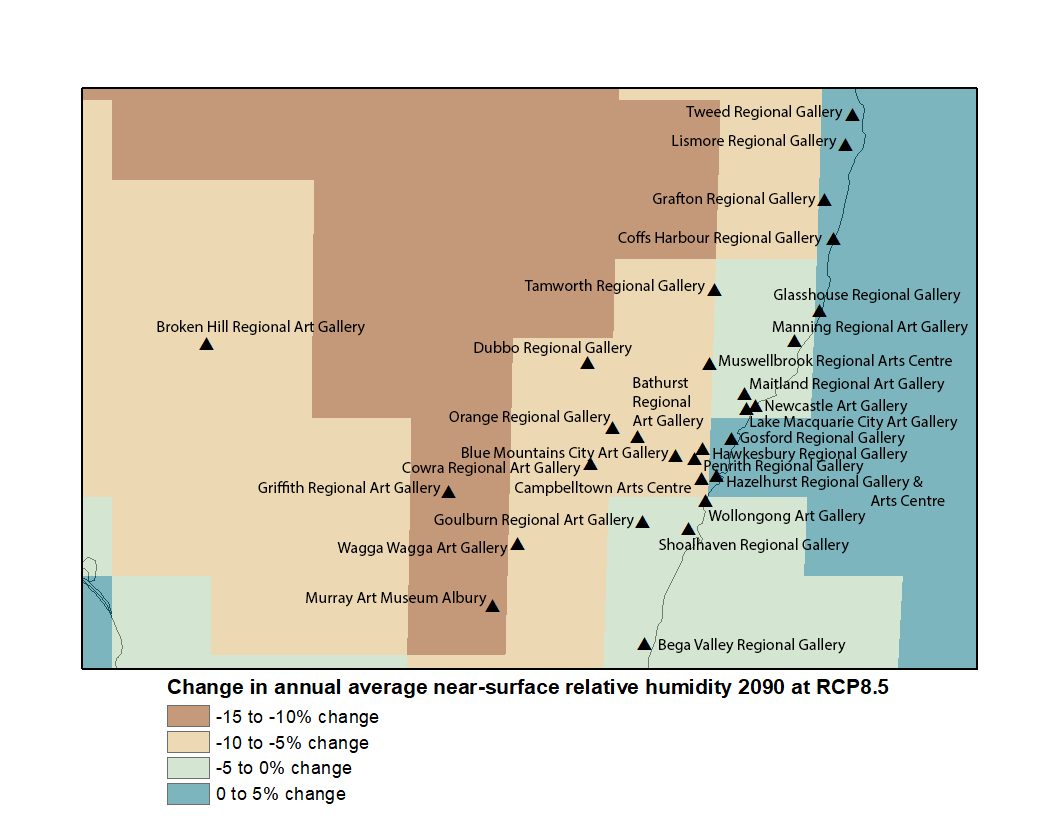
Climate projection data provided by CSIRO and Bureau of Meteorology, Climate Change in Australia website (http://www.climatechangeinaustralia.gov.au/), cited 5 November 2019. Also shown are regional council art galleries in New South Wales. *Map N3.6. First published as Figure 12 in Pagliarino & Meredith 2020, AICCM Bulletin.
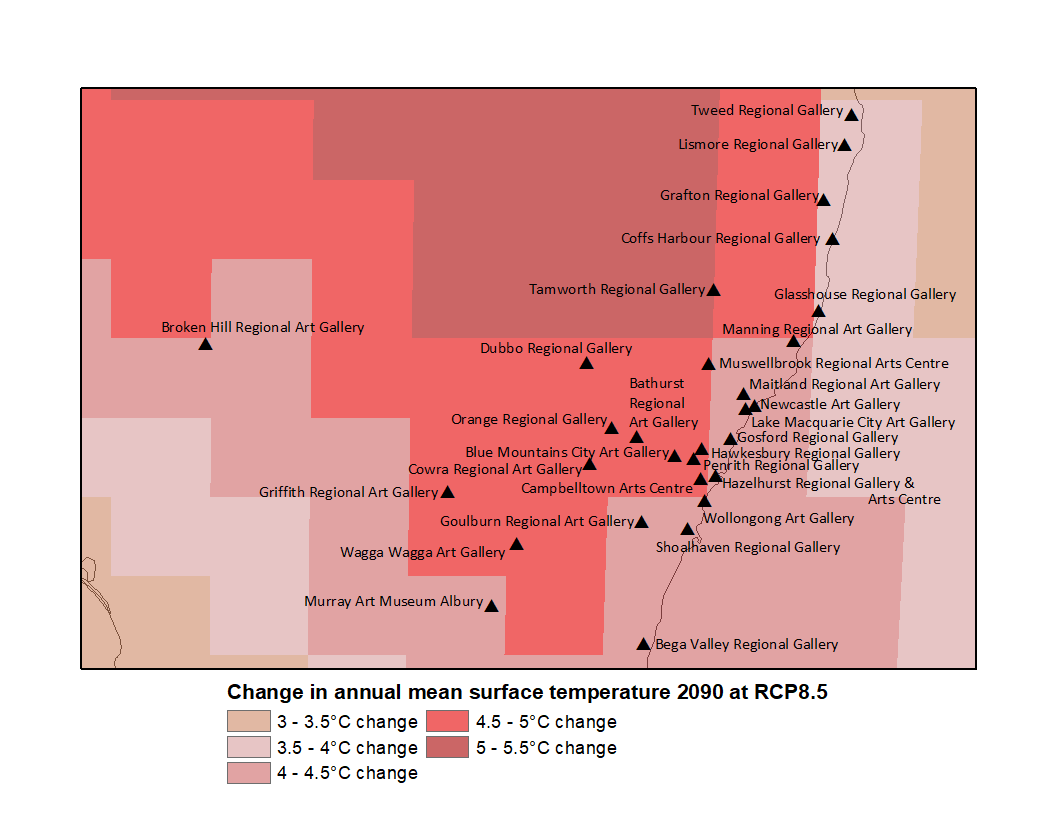
Map N1.5.
Map showing changes to the annual mean surface temperature by the year 2090 under scenario RCP4.5
Map N1.6.
Map showing changes to the annual mean surface temperature by the year 2090 under scenario RCP8.5
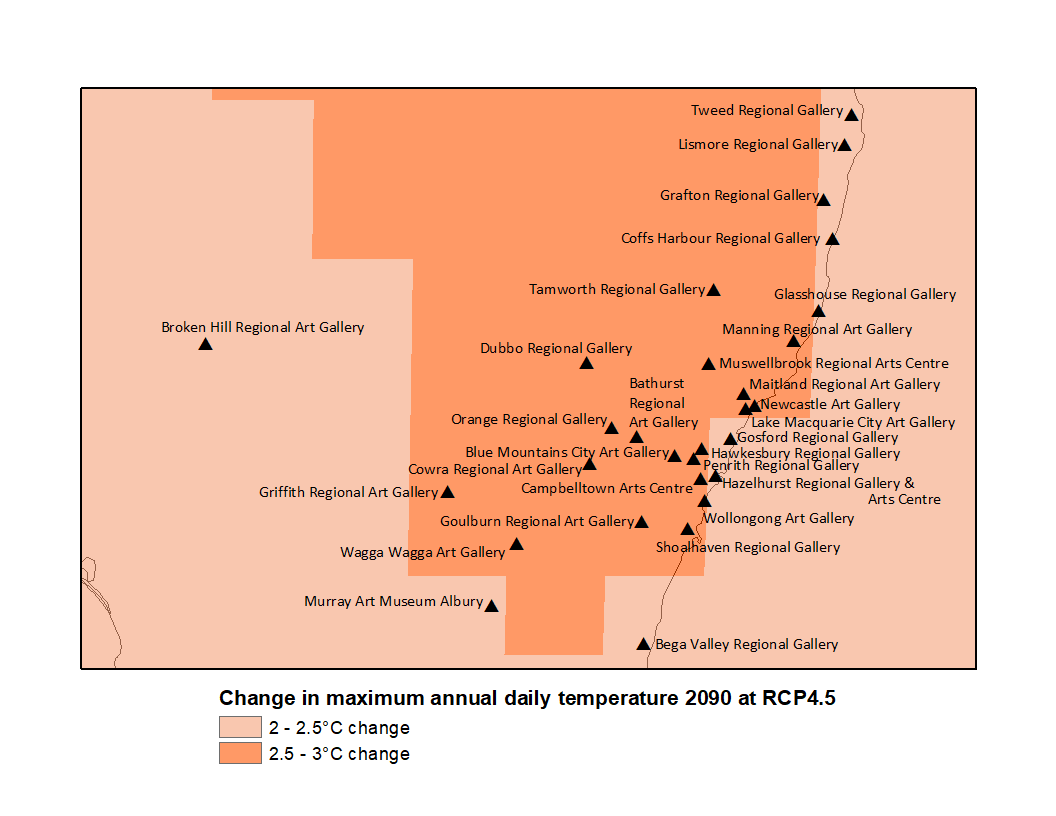
Map N2.5.
Map showing changes to the maximum annual daily temperature by the year 2090 under scenario RCP4.5
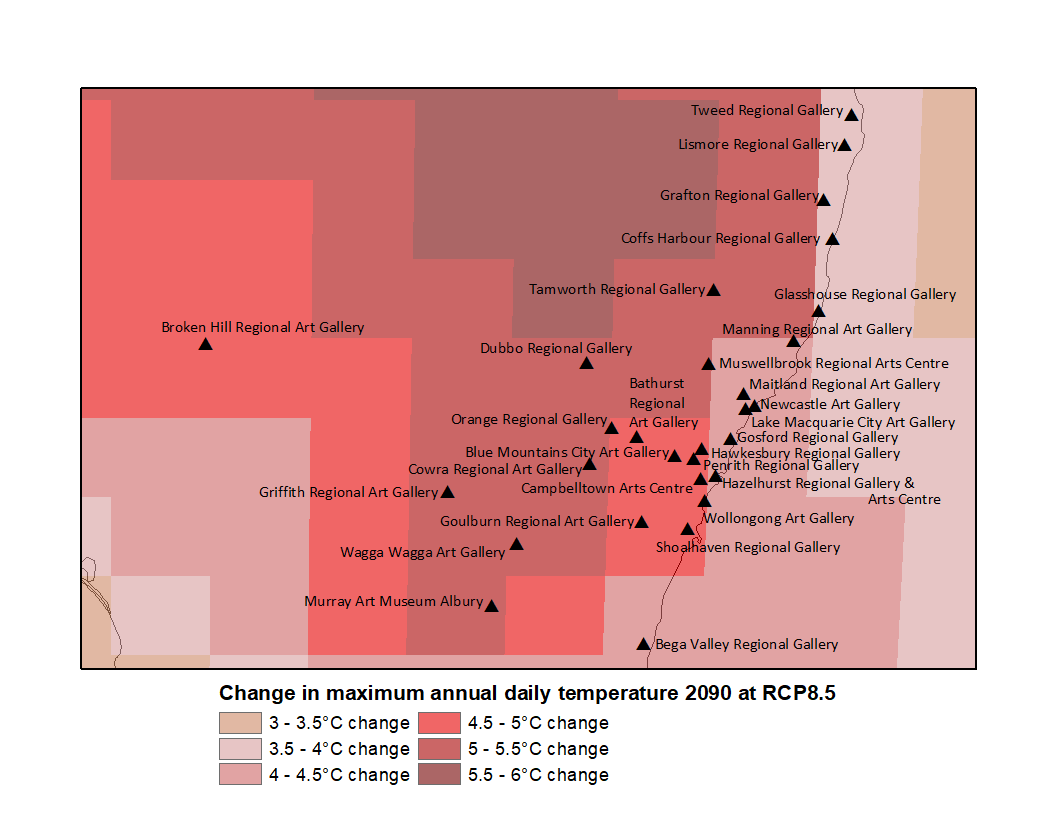
Map N2.6.
Map showing changes to the maximum annual daily temperature by the year 2090 under scenario RCP8.5
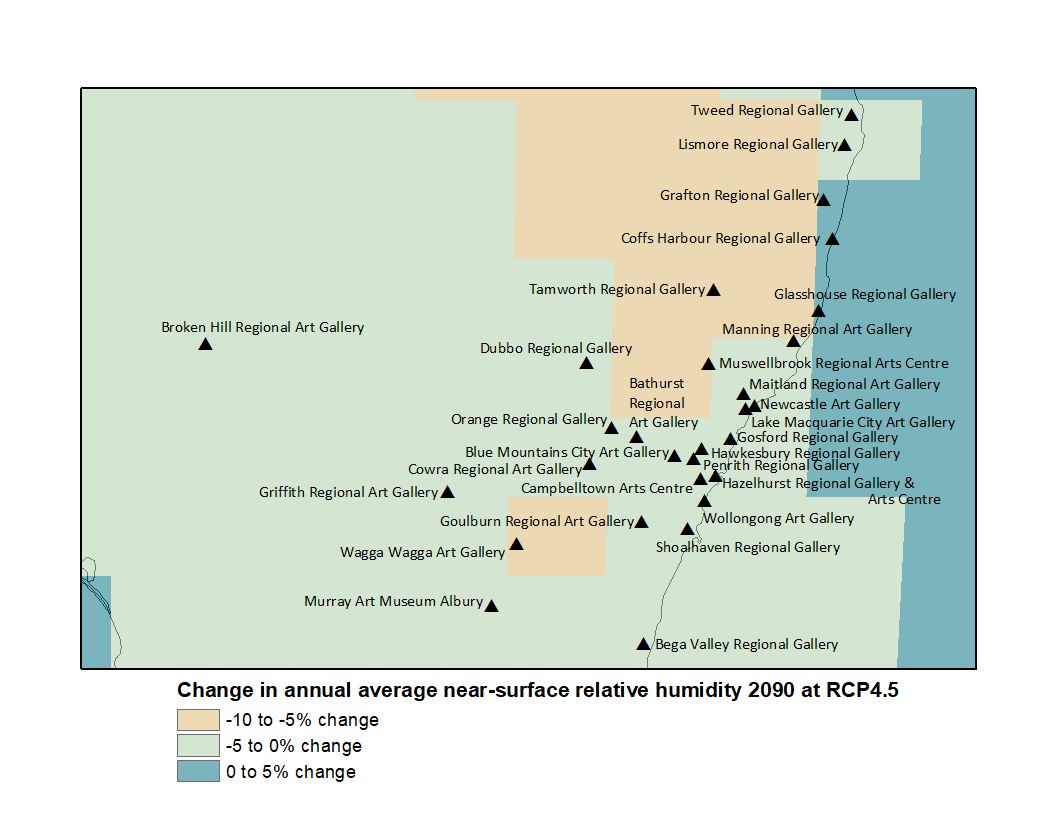
Map N3.5.
Map showing changes to the annual average near-surface relative humidity by the year 2090 under scenario RCP4.5
Map N3.6.
Map showing changes to the annual average near-surface relative humidity by the year 2090 under scenario RCP8.5
QUEENSLAND (NORTHERN)
2030 scenarios
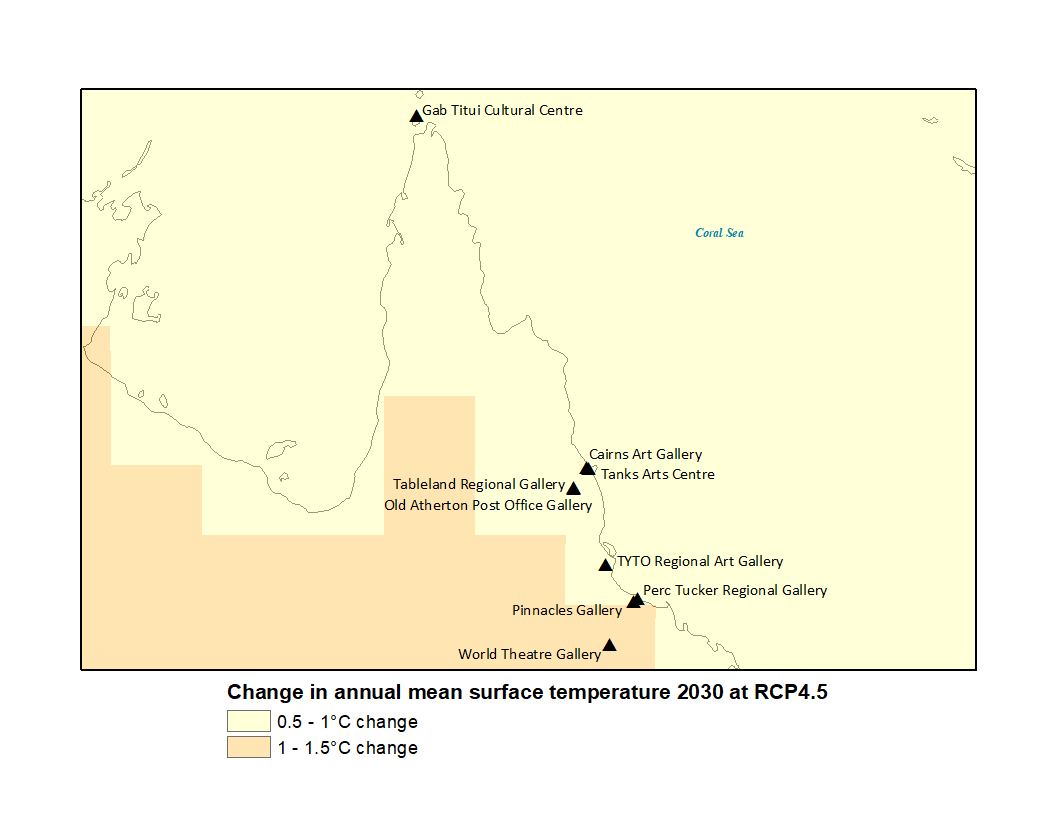
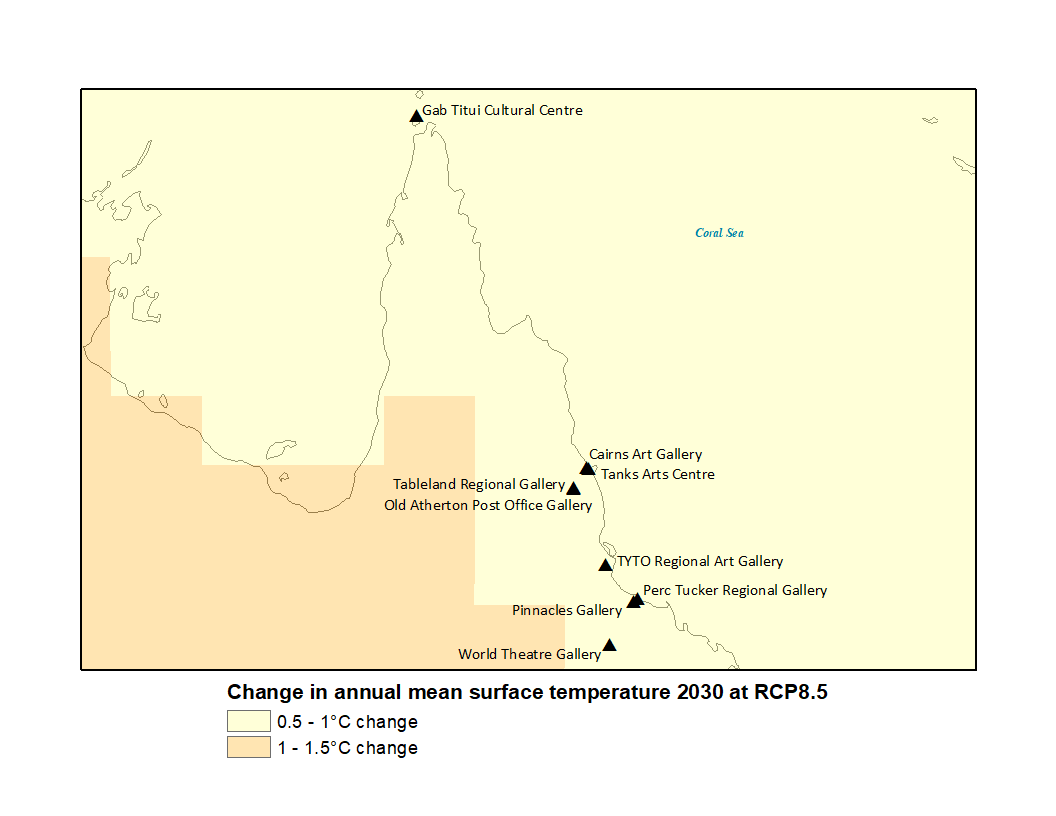
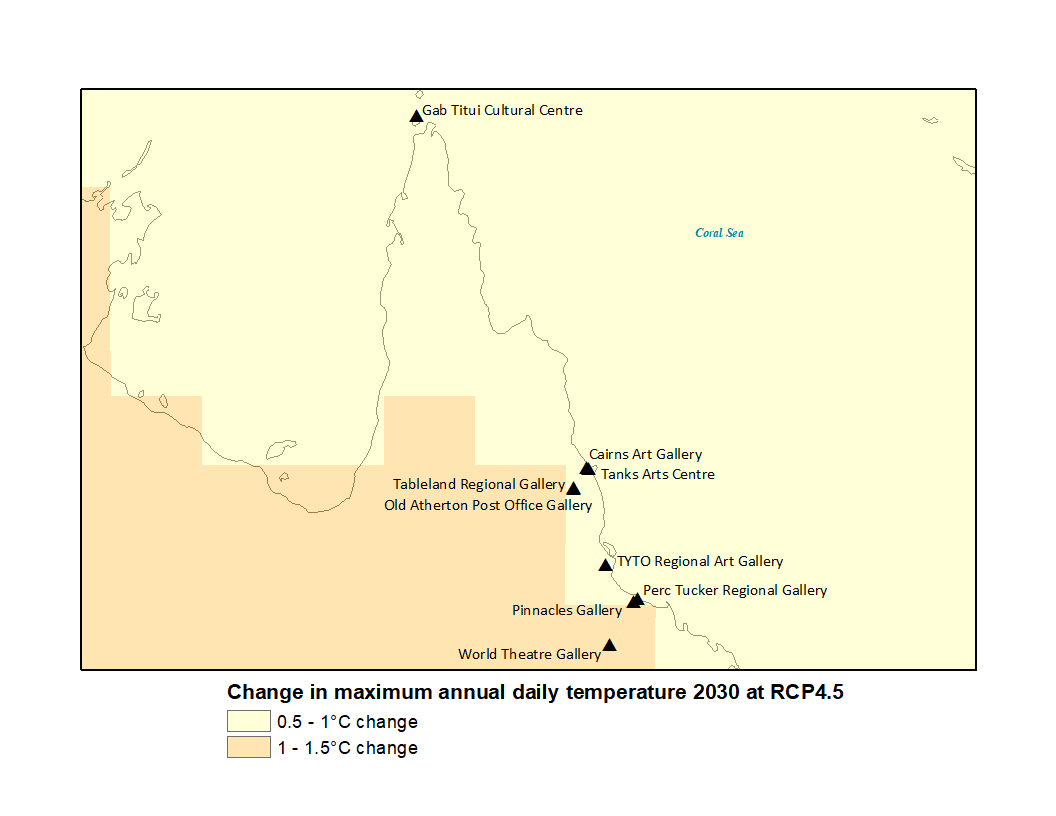
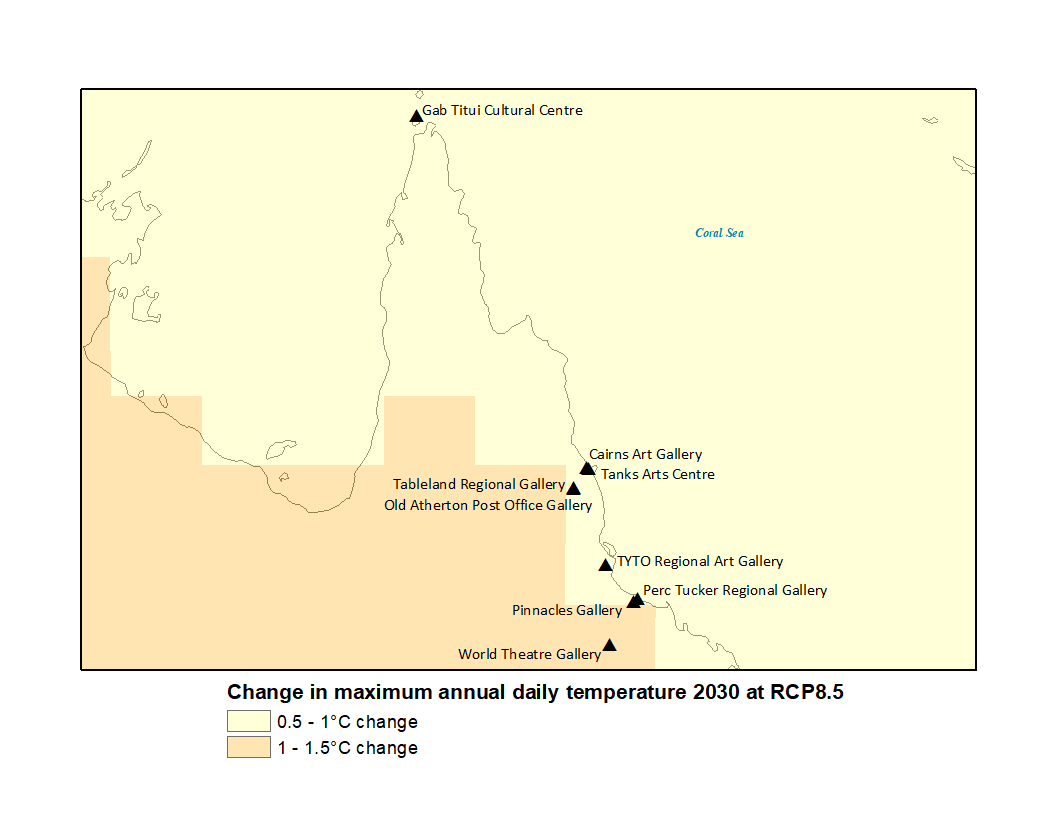
Climate projection data provided by CSIRO and Bureau of Meteorology, Climate Change in Australia website (http://www.climatechangeinaustralia.gov.au/), cited 5 November 2019. Also shown are regional council art galleries in northern Queensland.
Map Q1.1N.
Map showing changes to the annual mean surface temperature by the year 2030 under scenario RCP4.5
Map Q1.2N.
Map showing changes to the annual mean surface temperature by the year 2030 under scenario RCP8.5
Map Q2.1N.
Map showing changes to the maximum annual daily temperature by the year 2030 under scenario RCP4.5
Map Q2.2N.
Map showing changes to the maximum annual daily temperature by the year 2030 under scenario RCP8.5
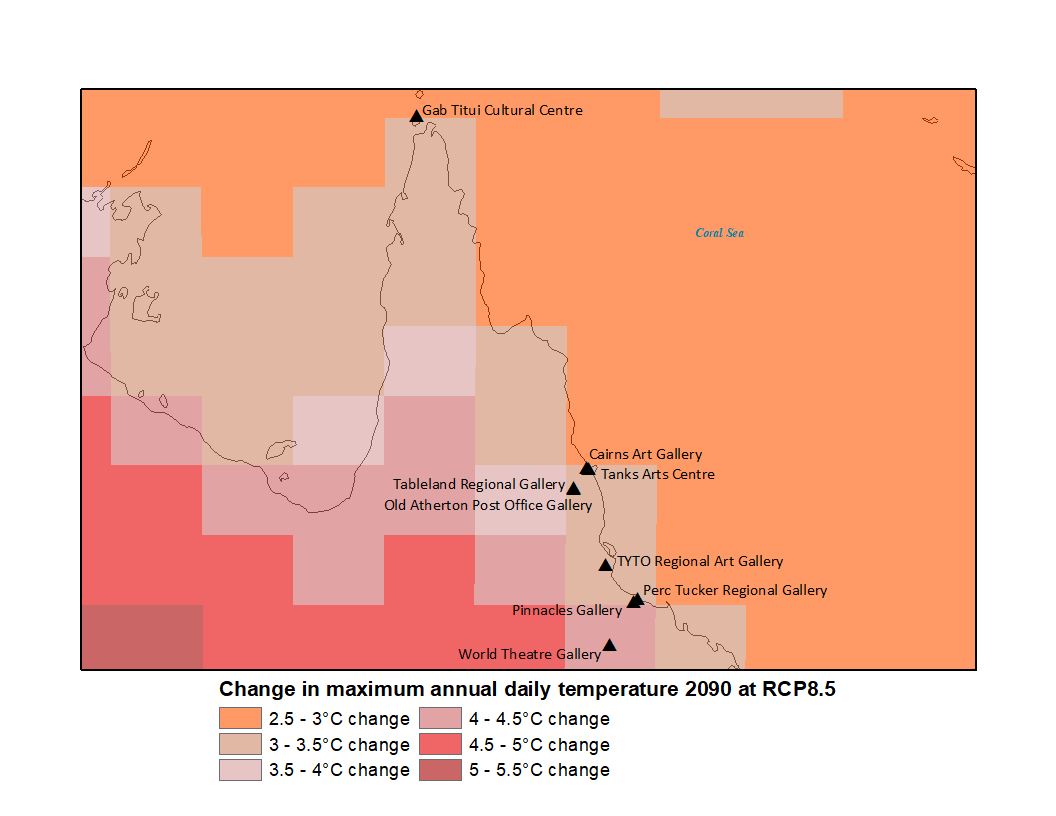
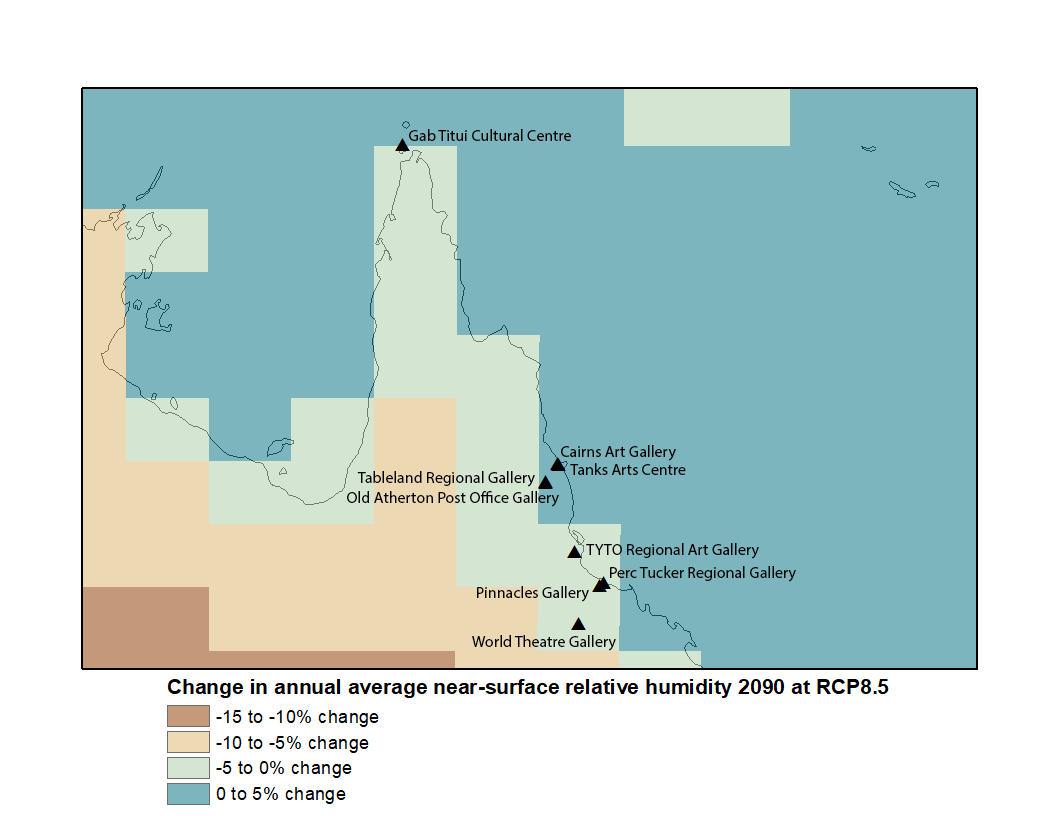
2090 scenarios
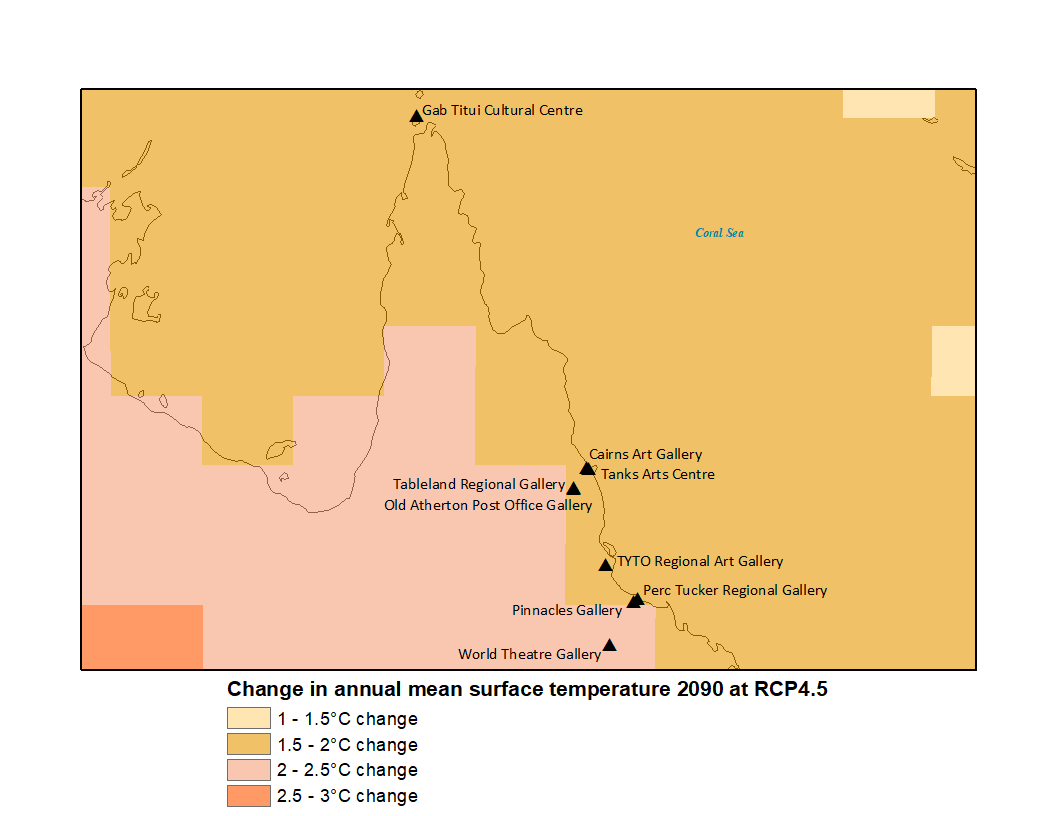
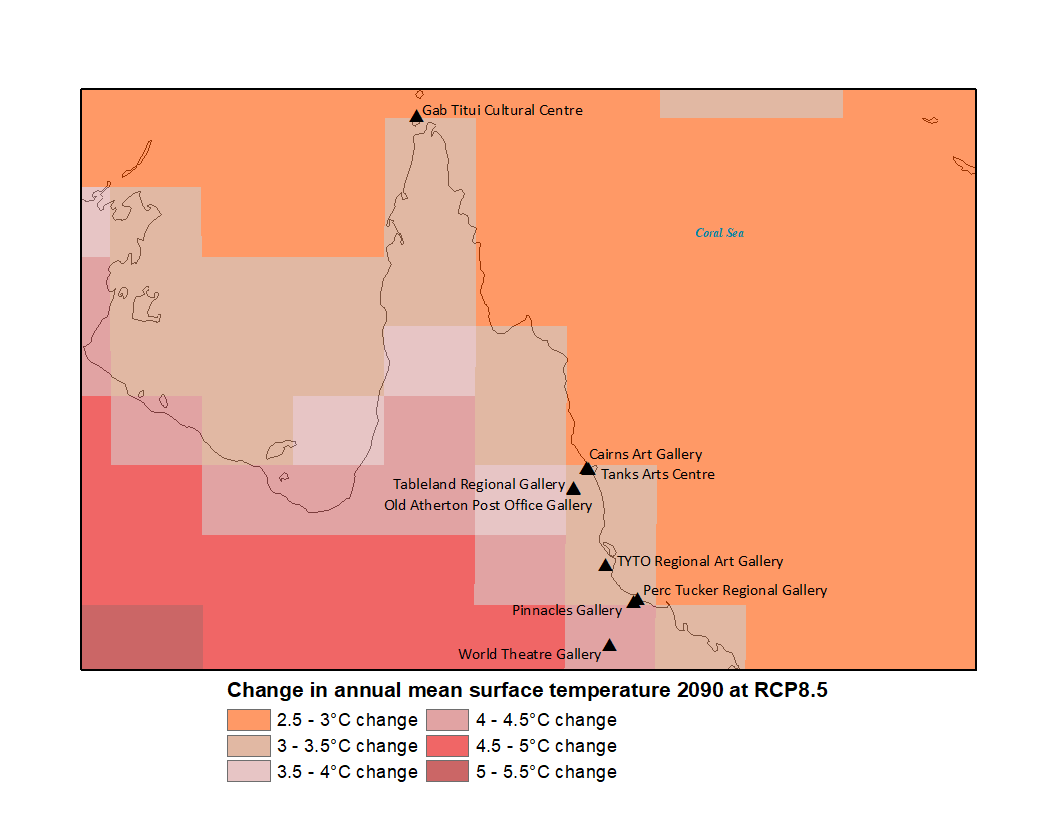
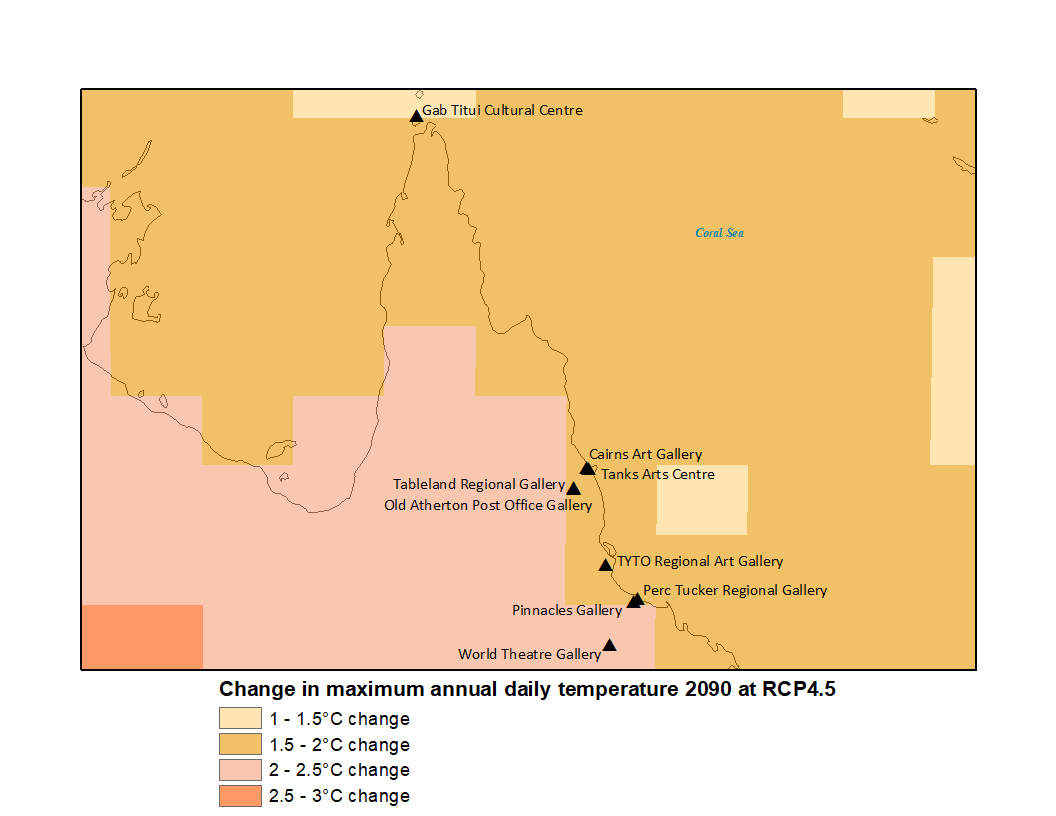
Climate projection data provided by CSIRO and Bureau of Meteorology, Climate Change in Australia website (http://www.climatechangeinaustralia.gov.au/), cited 5 November 2019. Also shown are regional council art galleries in northern Queensland. *Map Q3.6N. First published as Figure 12 in Pagliarino & Meredith 2020, AICCM Bulletin.
Map Q1.5N.
Map showing changes to the annual mean surface temperature by the year 2090 under scenario RCP4.5
Map Q1.6N.
Map showing changes to the annual mean surface temperature by the year 2090 under scenario RCP8.5
Map Q2.5N.
Map showing changes to the maximum annual daily temperature by the year 2090 under scenario RCP4.5
Map Q2.6N.
Map showing changes to the maximum annual daily temperature by the year 2090 under scenario RCP8.5
Map Q3.5N.
Map showing changes to the annual average near-surface relative humidity by the year 2090 under scenario RCP4.5

Map Q3.6N.
Map showing changes to the annual average near-surface relative humidity by the year 2090 under scenario RCP8.5
QUEENSLAND (SOUTHERN)
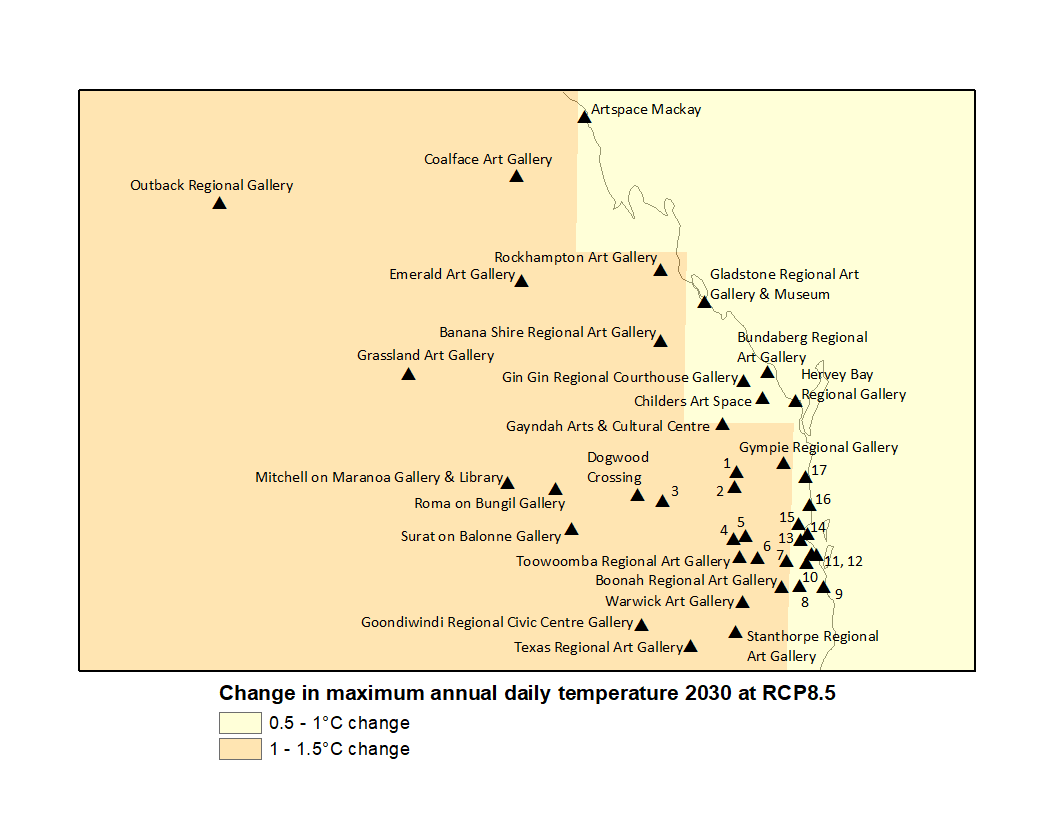
2030 scenarios
Climate projection data provided by CSIRO and Bureau of Meteorology, Climate Change in Australia website (http://www.climatechangeinaustralia.gov.au/), cited 5 November 2019. Also shown are regional council art galleries in southern Queensland. See Table 2 legend for additional map locations.
Map Q1.1S.
Map showing changes to the annual mean surface temperature by the year 2030 under scenario RCP4.5

Map Q1.2S.
Map showing changes to the annual mean surface temperature by the year 2030 under scenario RCP8.5

Map Q2.1S.
Map showing changes to the maximum annual daily temperature by the year 2030 under scenario RCP4.5

Map Q2.2S.
Map showing changes to the maximum annual daily temperature by the year 2030 under scenario RCP8.5
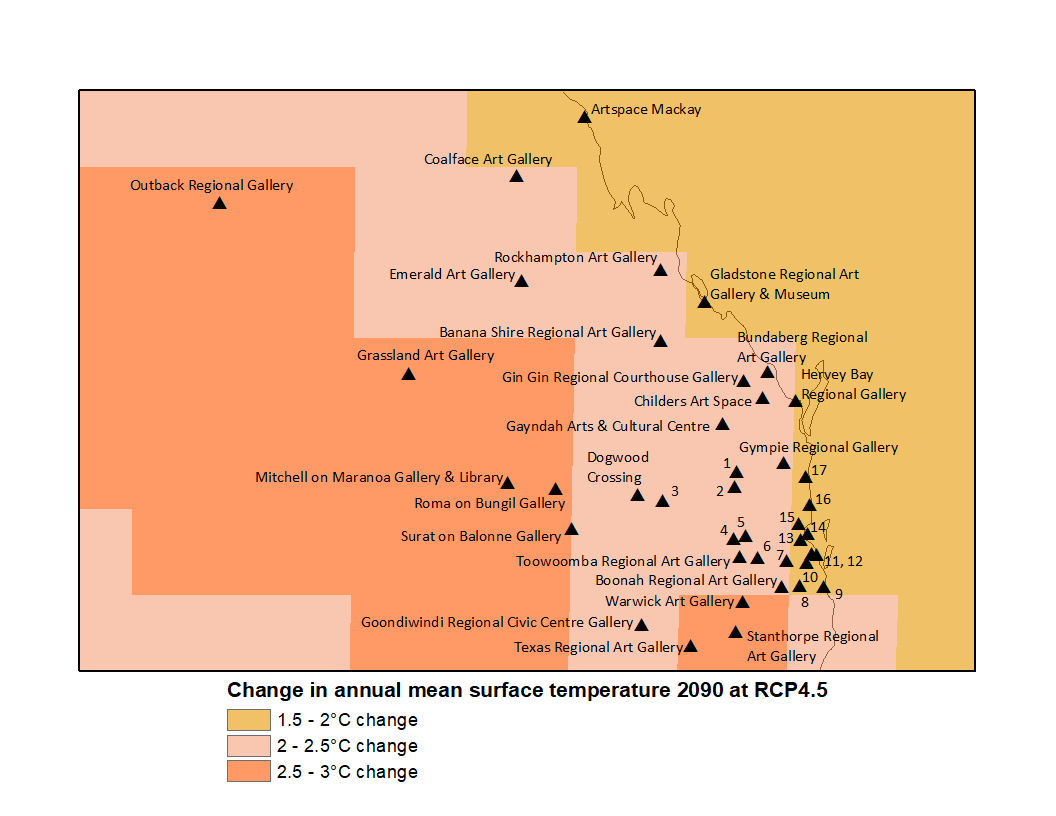
2090 scenarios
Climate projection data provided by CSIRO and Bureau of Meteorology, Climate Change in Australia website (http://www.climatechangeinaustralia.gov.au/), cited 5 November 2019. Also shown are regional council art galleries in southern Queensland. See Table 2 legend for additional map locations. *Map Q2.5S. First published as Figure 12 in Pagliarino & Meredith 2020, AICCM Bulletin.
Map Q1.5S.
Map showing changes to the annual mean surface temperature by the year 2090 under scenario RCP4.5
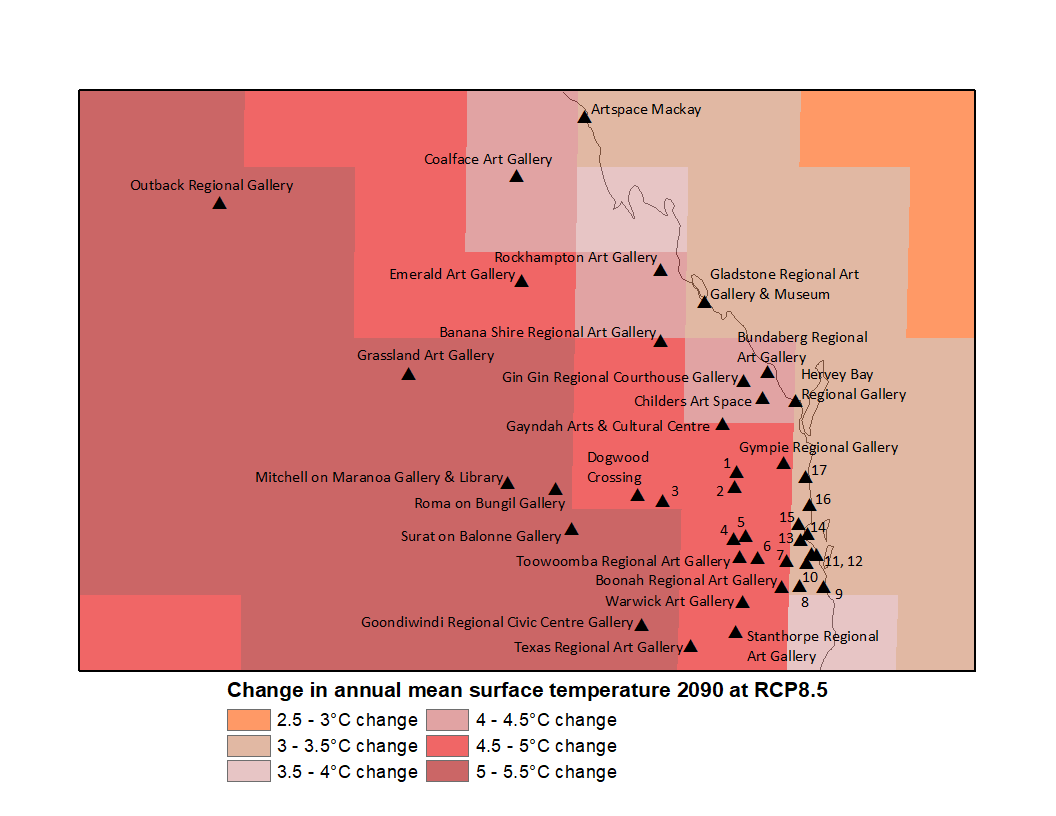
Map Q1.6S.
Map showing changes to the annual mean surface temperature by the year 2090 under scenario RCP8.5
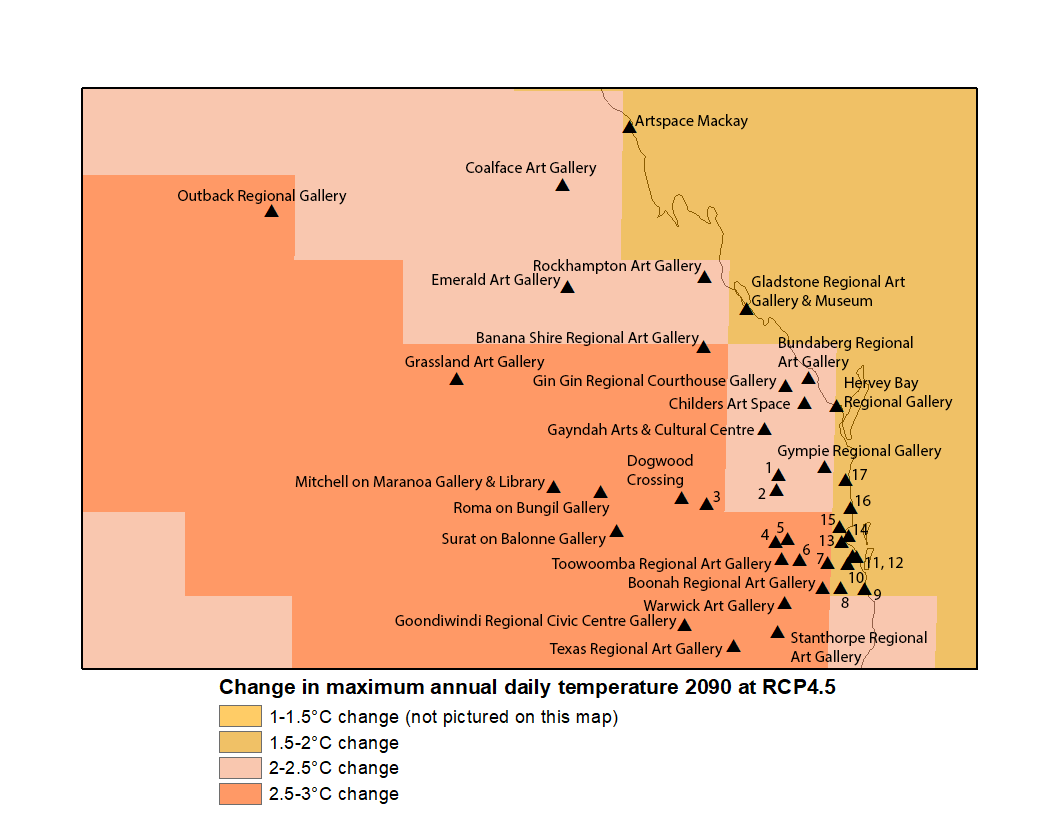
Map Q2.5S.
Map showing changes to the maximum annual daily temperature by the year 2090 under scenario RCP4.5
Map Q2.6S.
Map showing changes to the maximum annual daily temperature by the year 2090 under scenario RCP8.5

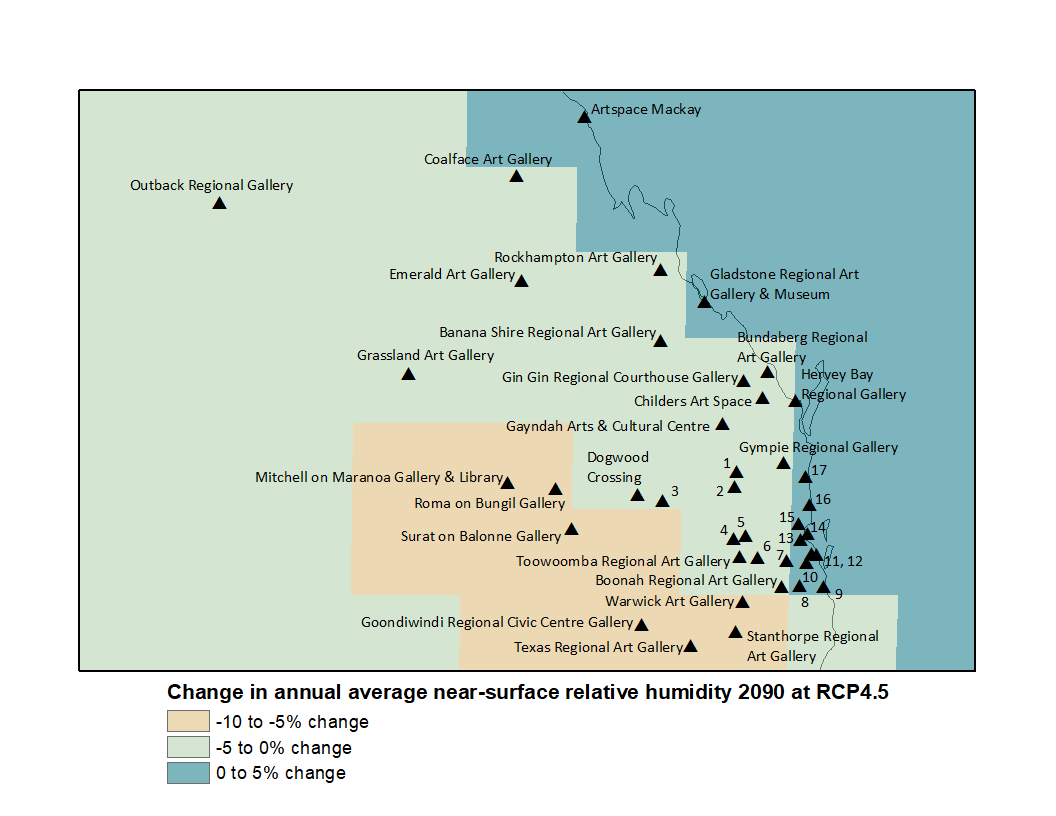
Map Q3.5S.
Map showing changes to the annual average near-surface relative humidity by the year 2090 under scenario RCP4.5
Map Q3.6S.
Map showing changes to the annual average near-surface relative humidity by the year 2090 under scenario RCP8.5
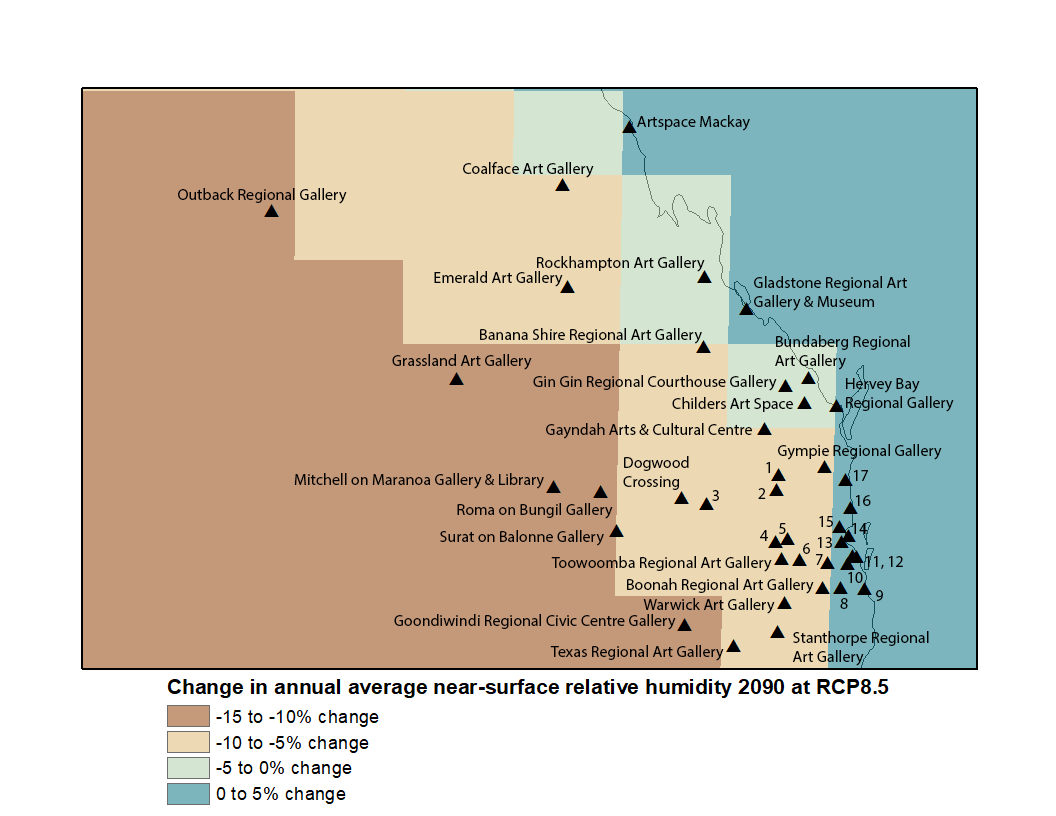
Table 2. Legend of numbered locations in maps Q1.1S, Q1.2S, Q1.5S, Q1.6S, Q2.1S, Q2.2S, Q2.5S, Q2.6S, Q3.5S and Q3.6S
| 1 | Wondai Regional Art Gallery |
| 2 | Kingaroy Regional Art Gallery |
| 3 | Lapunyah Art Gallery |
| 4 | Rosalie Gallery |
| 5 | Crows Nest Regional Art Gallery |
| 6 | Ipswich Art Gallery |
| 7 | Lockyer Valley Art Gallery |
| 8 | The Gallery & The Centre Beaudesert |
| 9 | Gold Coast City Art Gallery |
| 10 | Logan Art Gallery |
| 11 | Redland Art Gallery (Capalaba) |
| 12 | Redland Art Gallery (Cleveland) |
| 13 | Pine Rivers Art Gallery |
| 14 | Redcliffe Art Gallery |
| 15 | Caboolture Regional Art Gallery |
| 16 | Caloundra Regional Gallery |
| 17 | Noosa Regional Gallery |
SOUTH AUSTRALIA
2030 scenarios
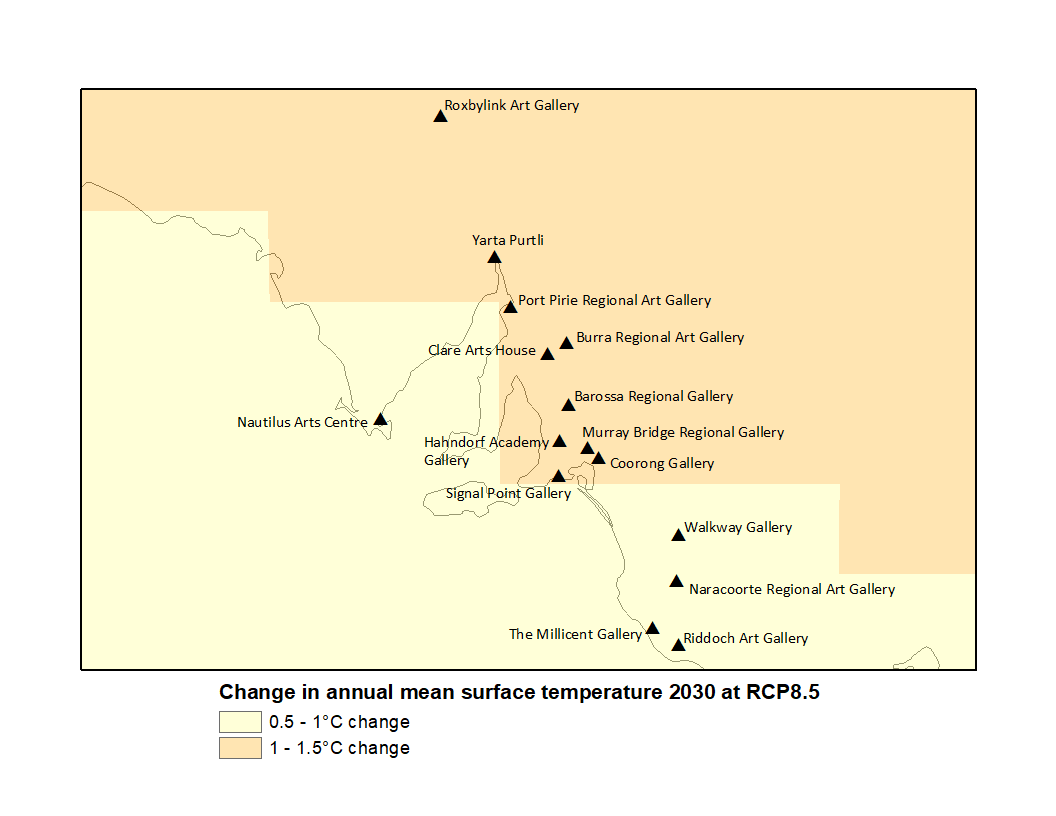
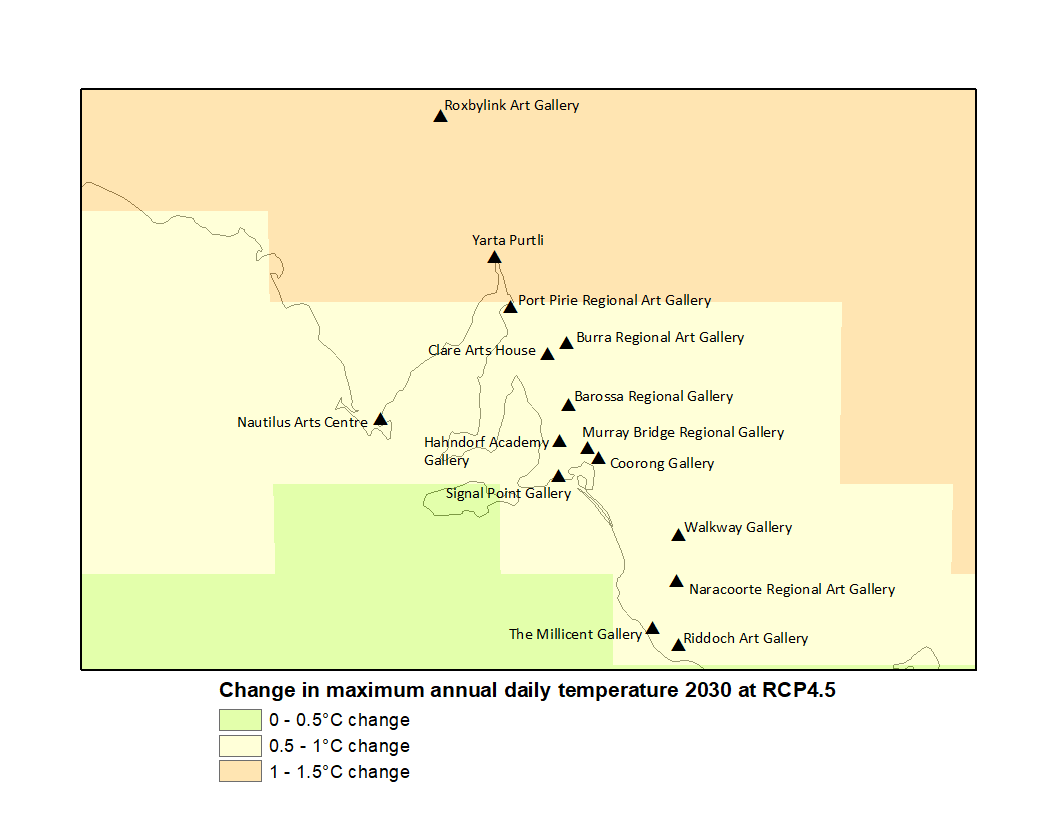
Climate projection data provided by CSIRO and Bureau of Meteorology, Climate Change in Australia website (http://www.climatechangeinaustralia.gov.au/), cited 5 November 2019. Also shown are regional council art galleries in South Australia.
Map S1.1.
Map showing changes to the annual mean surface temperature by the year 2030 under scenario RCP4.5

Map S1.2.
Map showing changes to the annual mean surface temperature by the year 2030 under scenario RCP8.5
Map S2.1.
Map showing changes to the maximum annual daily temperature by the year 2030 under scenario RCP4.5
Map S2.2.
Map showing changes to the maximum annual daily temperature by the year 2030 under scenario RCP8.5

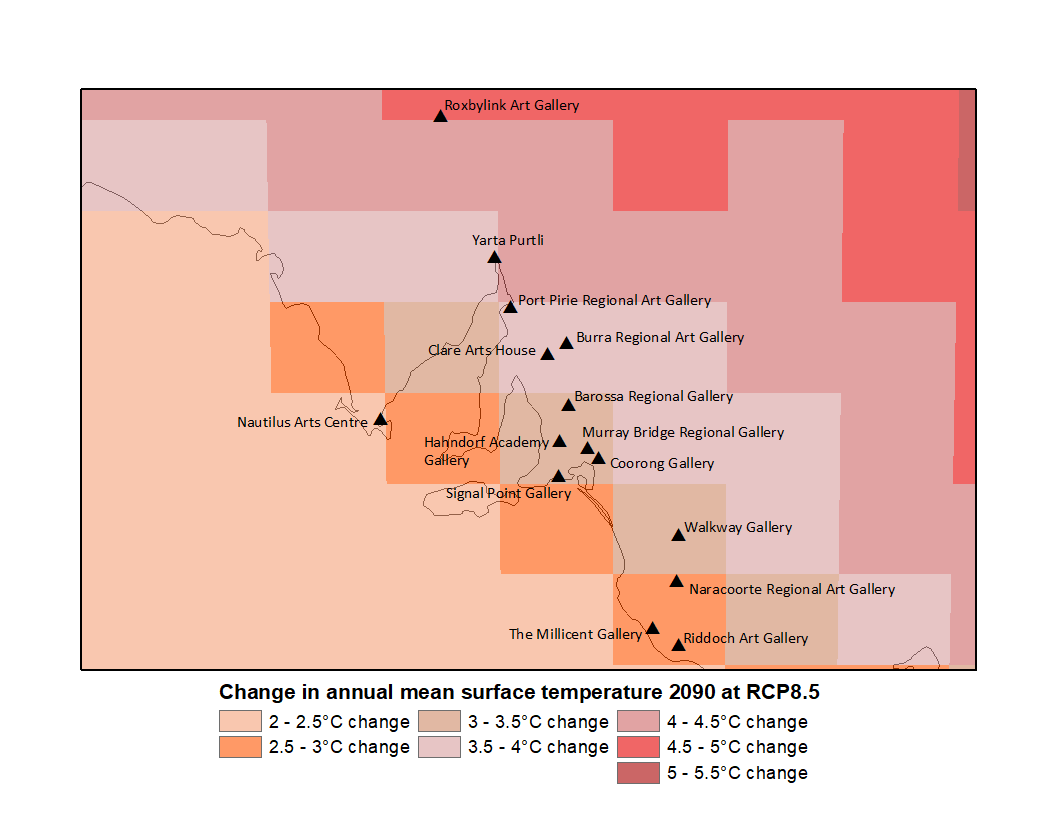
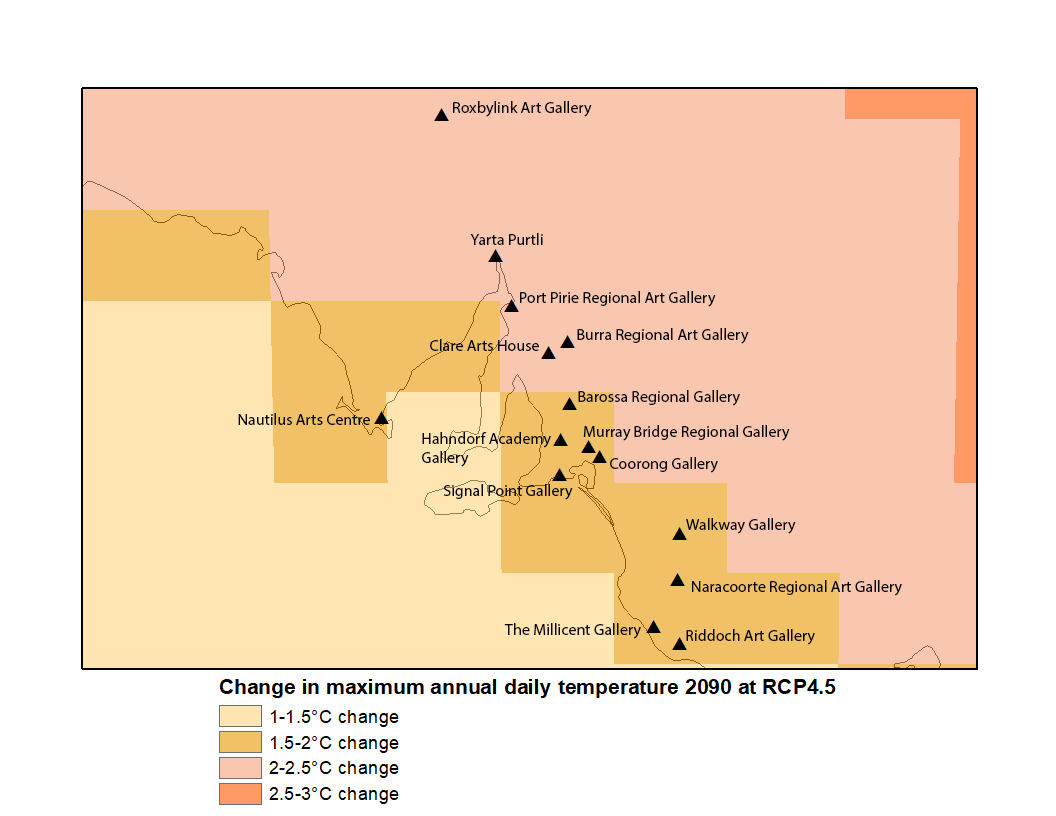
2090 scenarios
Climate projection data provided by CSIRO and Bureau of Meteorology, Climate Change in Australia website (http://www.climatechangeinaustralia.gov.au/), cited 5 November 2019. Also shown are regional council art galleries in South Australia. *Map S2.5. First published as Figure 12 in Pagliarino & Meredith 2020, AICCM Bulletin.
Map S1.5.
Map showing changes to the annual mean surface temperature by the year 2090 under scenario RCP4.5

Map S1.6.
Map showing changes to the annual mean surface temperature by the year 2090 under scenario RCP8.5
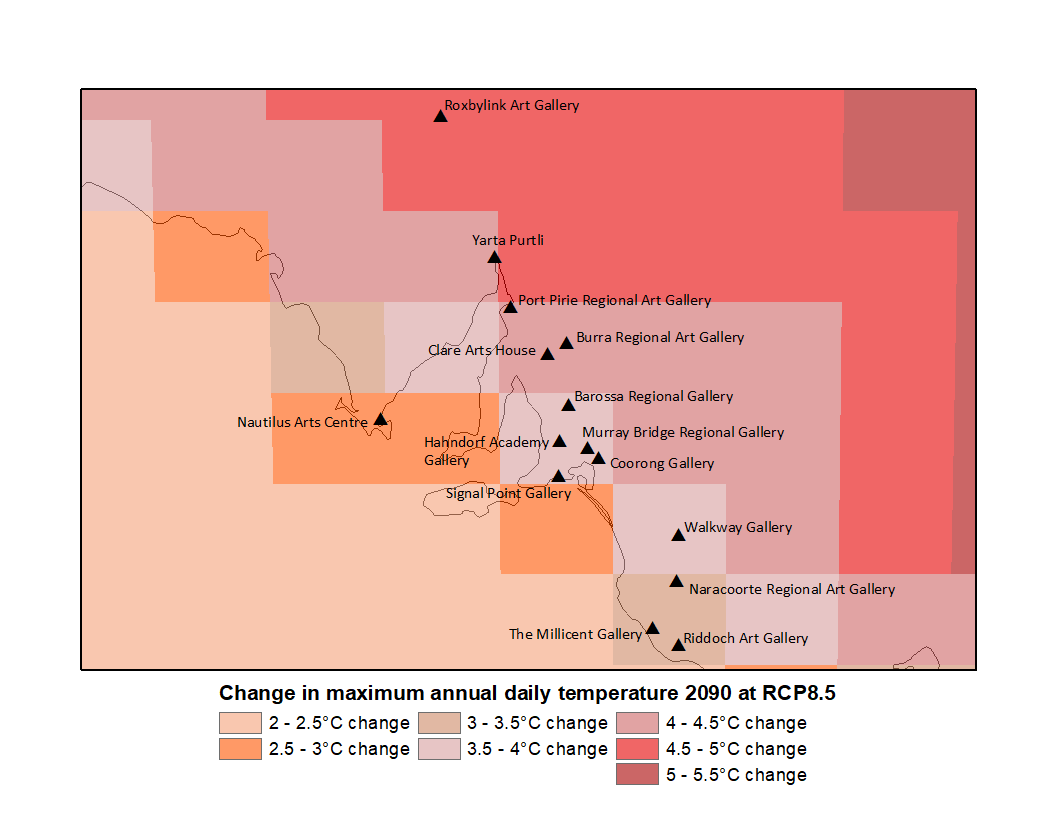
Map S2.5.
Map showing changes to the maximum annual daily temperature by the year 2090 under scenario RCP4.5
Map S2.6.
Map showing changes to the maximum annual daily temperature by the year 2090 under scenario RCP8.5
Map S3.5.
Map showing changes to the annual average near-surface relative humidity by the year 2090 under scenario RCP4.5
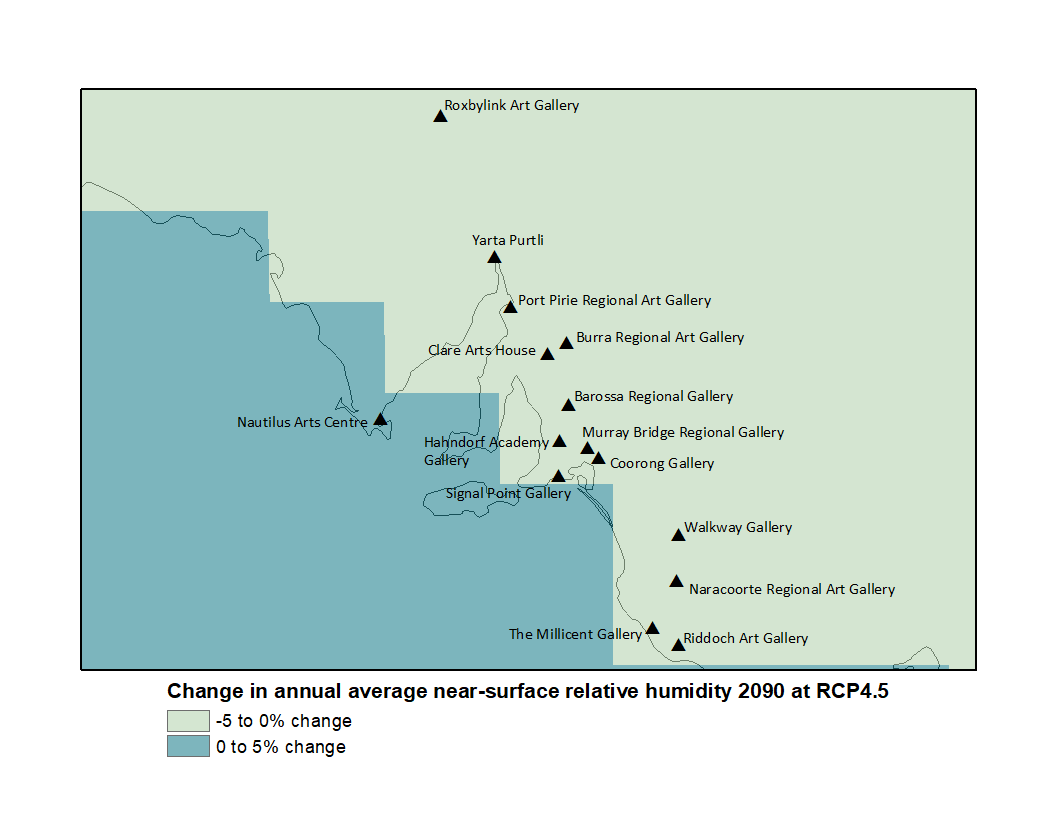
Map S3.6.
Map showing changes to the annual average near-surface relative humidity by the year 2090 under scenario RCP8.5

TASMANIA
2030 scenarios
Climate projection data provided by CSIRO and Bureau of Meteorology, Climate Change in Australia website (http://www.climatechangeinaustralia.gov.au/), cited 5 November 2019. Also shown are regional council art galleries in Tasmania.
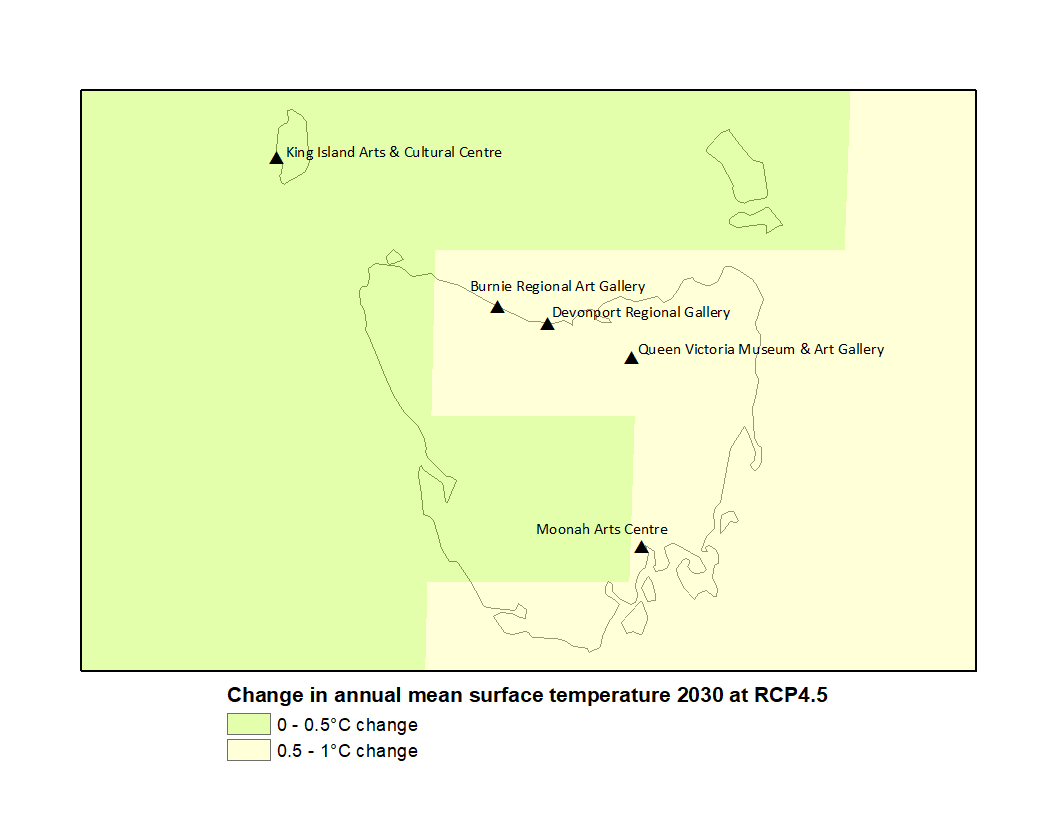
Map T1.1.
Map showing changes to the annual mean surface temperature by the year 2030 under scenario RCP4.5
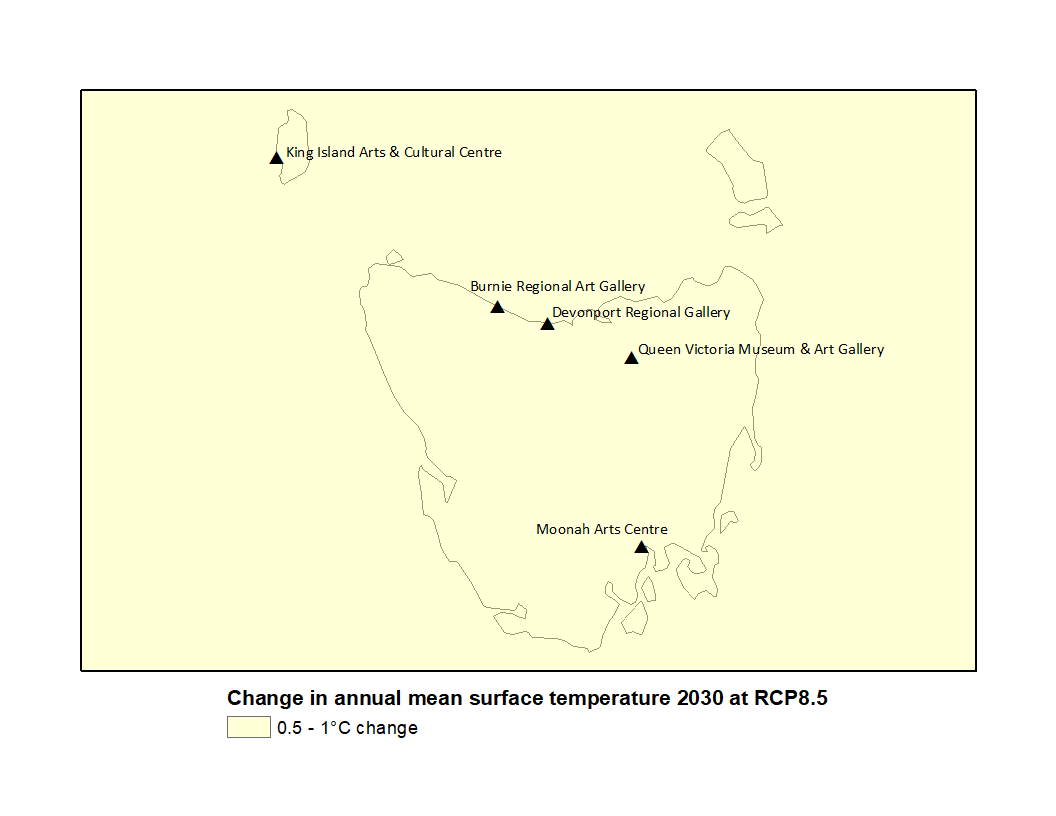
Map T1.2.
Map showing changes to the annual mean surface temperature by the year 2030 under scenario RCP8.5
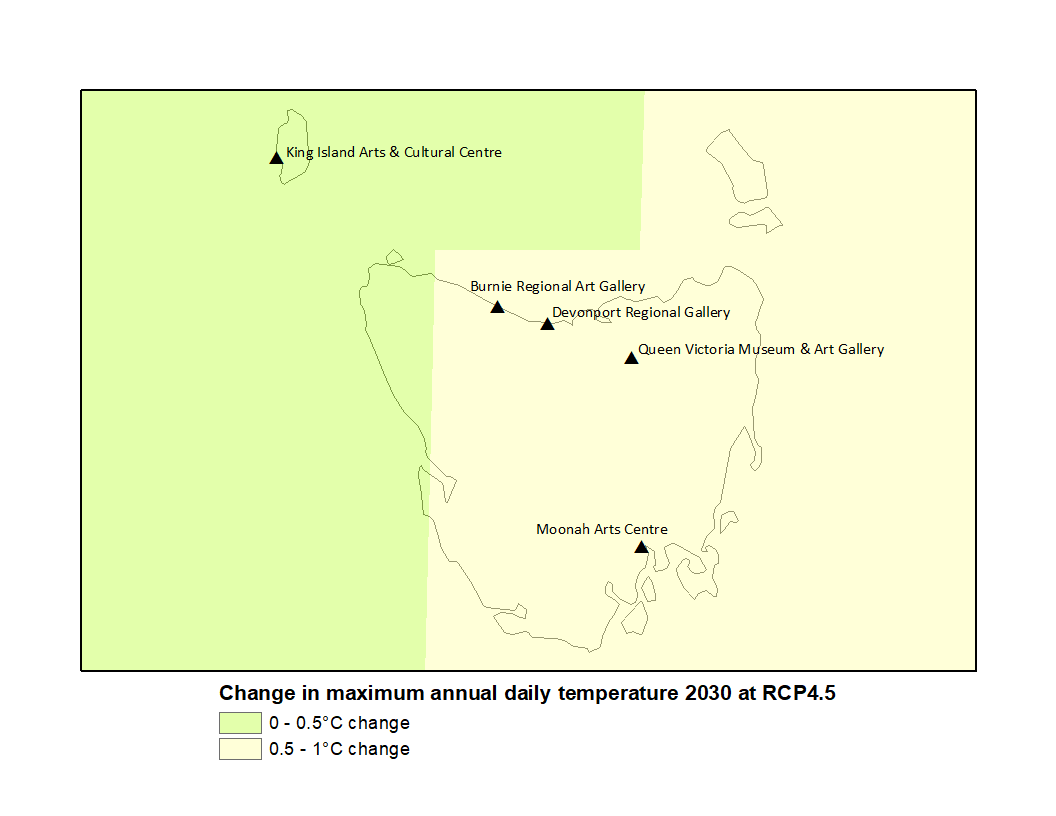
Map T2.1.
Map showing changes to the maximum annual daily temperature by the year 2030 under scenario RCP4.5
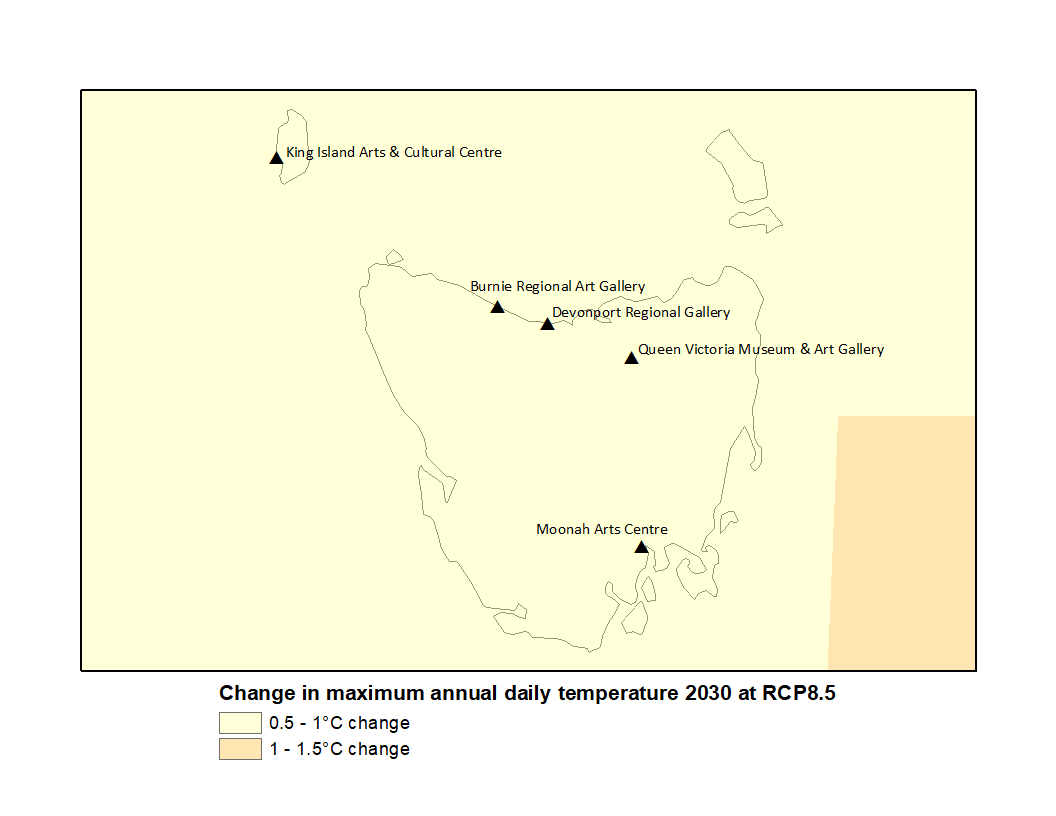
Map T2.2.
Map showing changes to the maximum annual daily temperature by the year 2030 under scenario RCP8.5
2090 scenarios
Climate projection data provided by CSIRO and Bureau of Meteorology, Climate Change in Australia website (http://www.climatechangeinaustralia.gov.au/), cited 5 November 2019. Also shown are regional council art galleries in Tasmania. *Map T2.5. First published as Figure 12 in Pagliarino & Meredith 2020, AICCM Bulletin.
Map T1.5.
Map showing changes to the annual mean surface temperature by the year 2090 under scenario RCP4.5
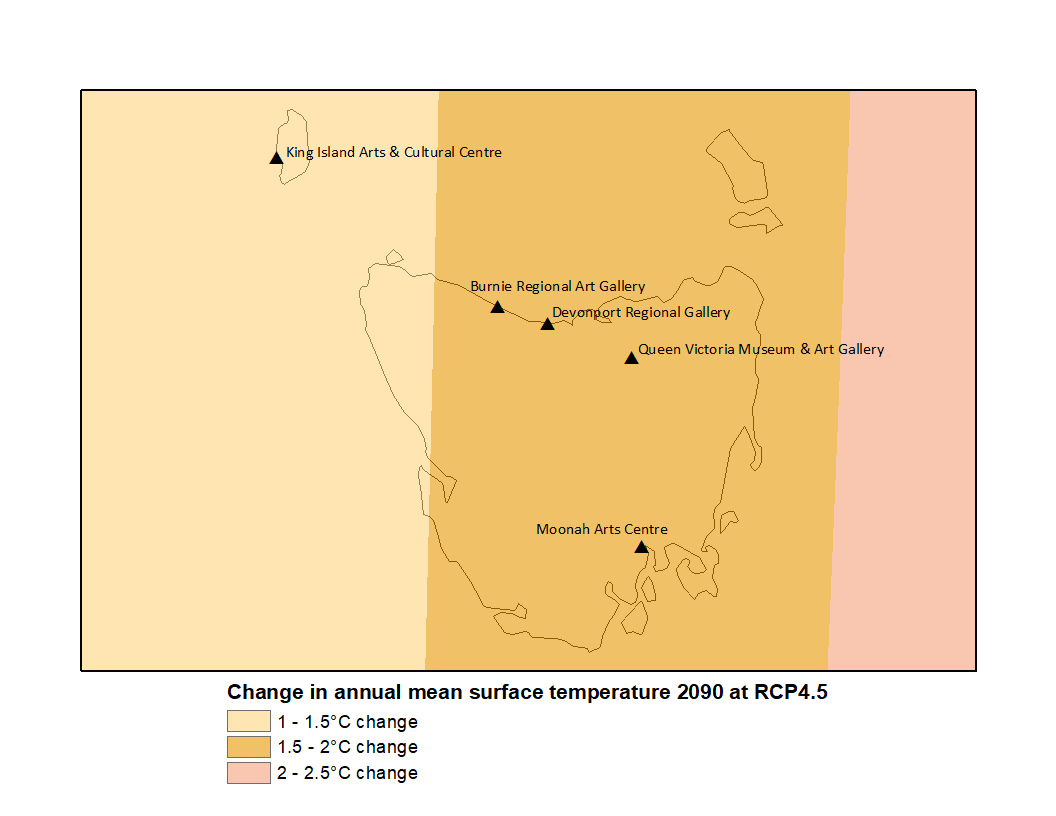
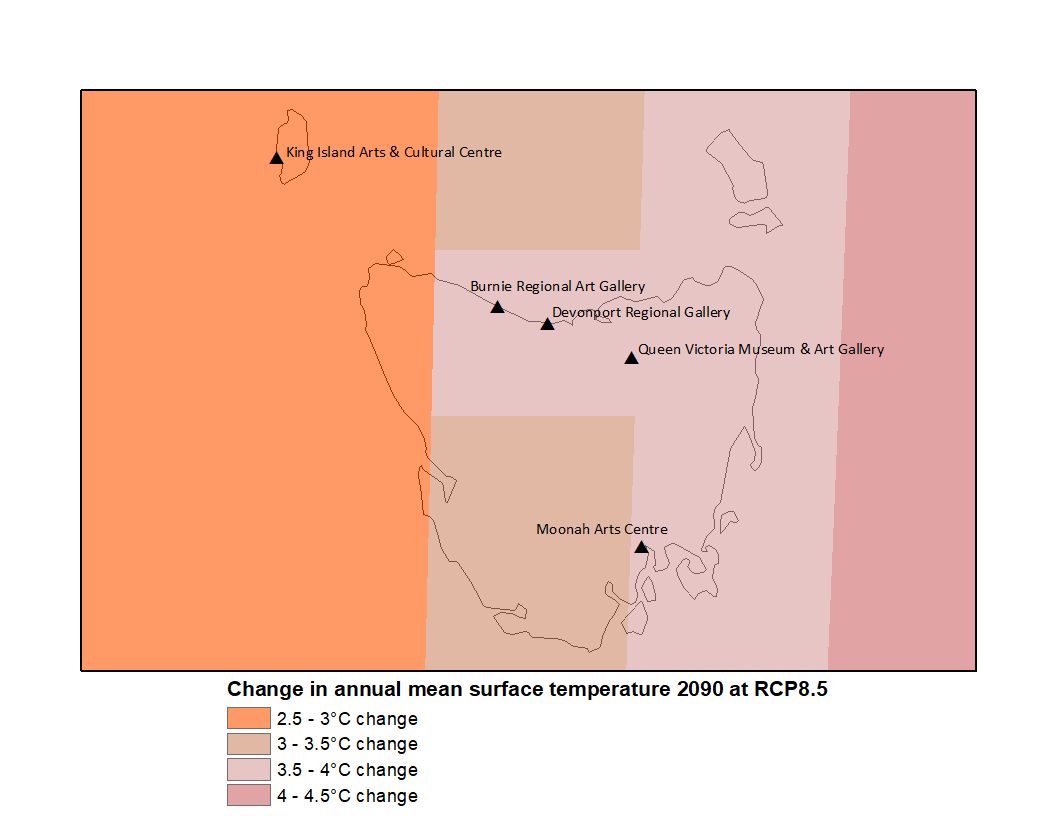
Map T1.6.
Map showing changes to the annual mean surface temperature by the year 2090 under scenario RCP8.5
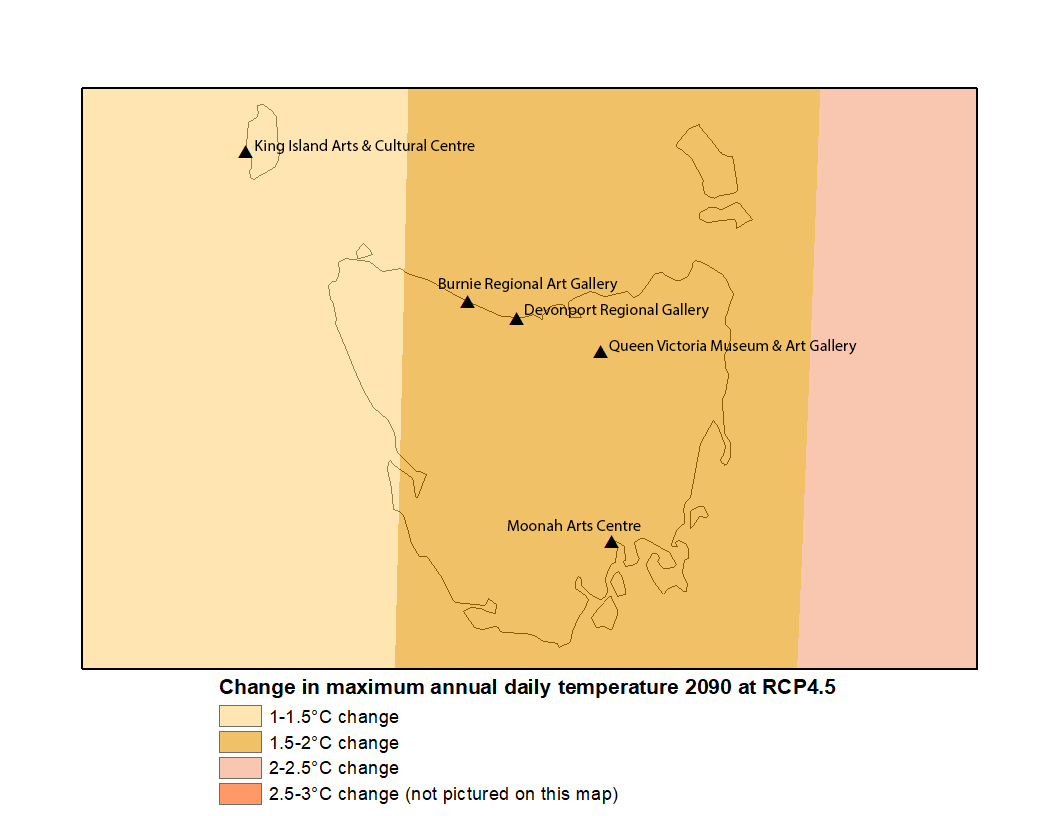
Map T2.5.
Map showing changes to the maximum annual daily temperature by the year 2090 under scenario RCP4.5
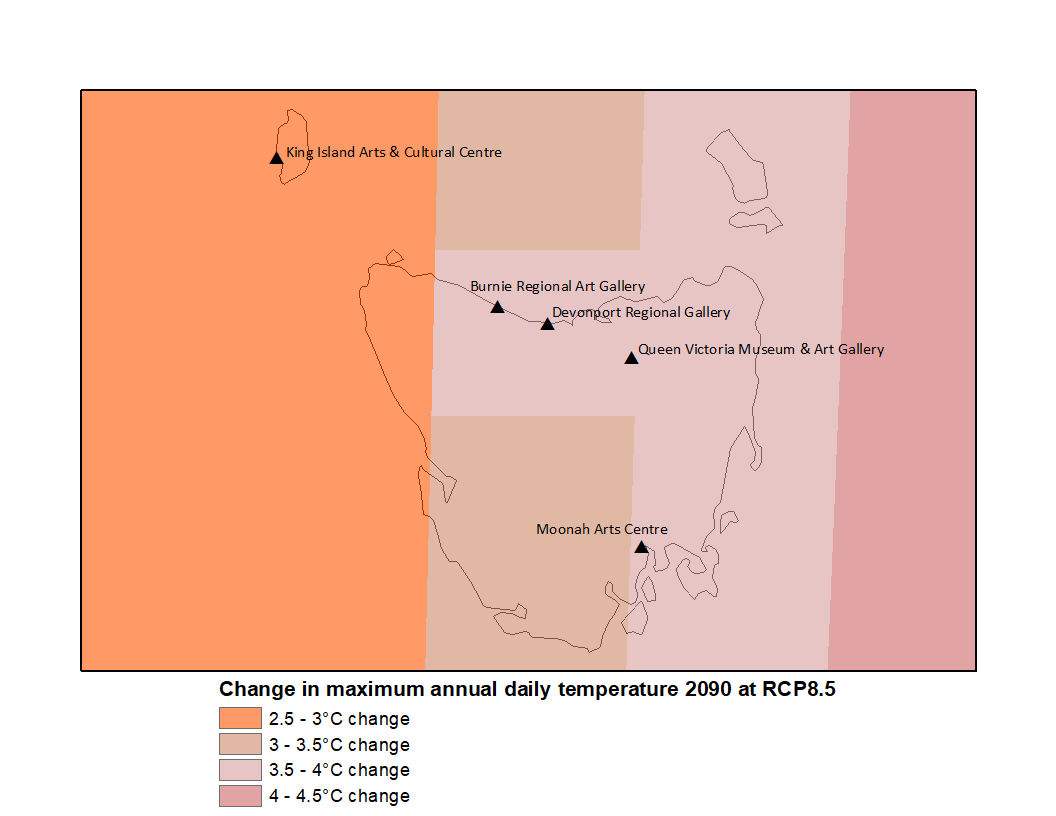
Map T2.6.
Map showing changes to the maximum annual daily temperature by the year 2090 under scenario RCP8.5
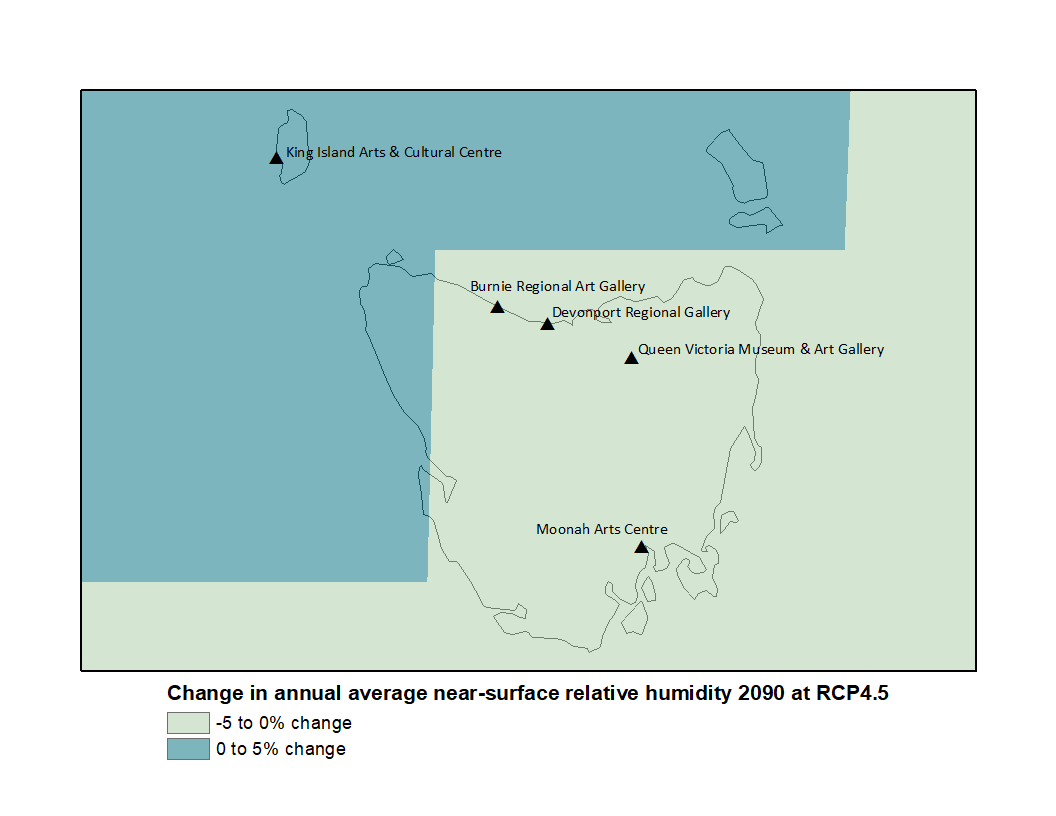
Map T3.5.
Map showing changes to the annual average near-surface relative humidity by the year 2090 under scenario RCP4.5
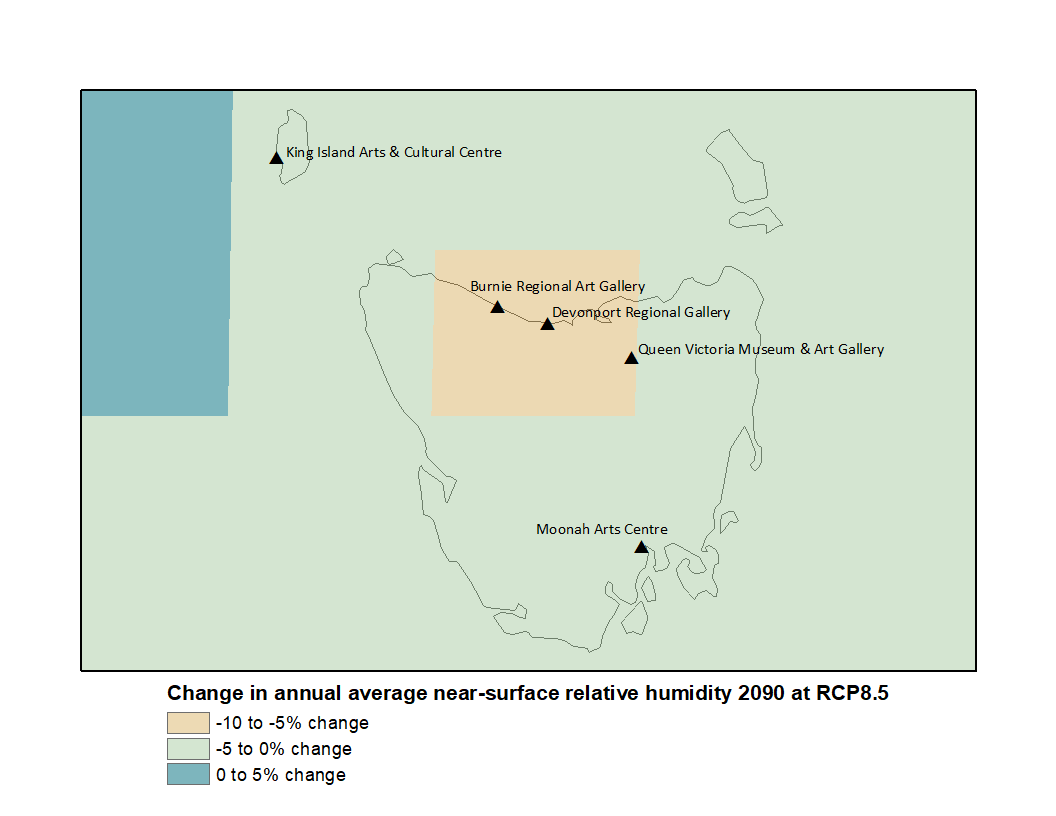
Map T3.6.
Map showing changes to the annual average near-surface relative humidity by the year 2090 under scenario RCP8.5
VICTORIA
2030 scenarios
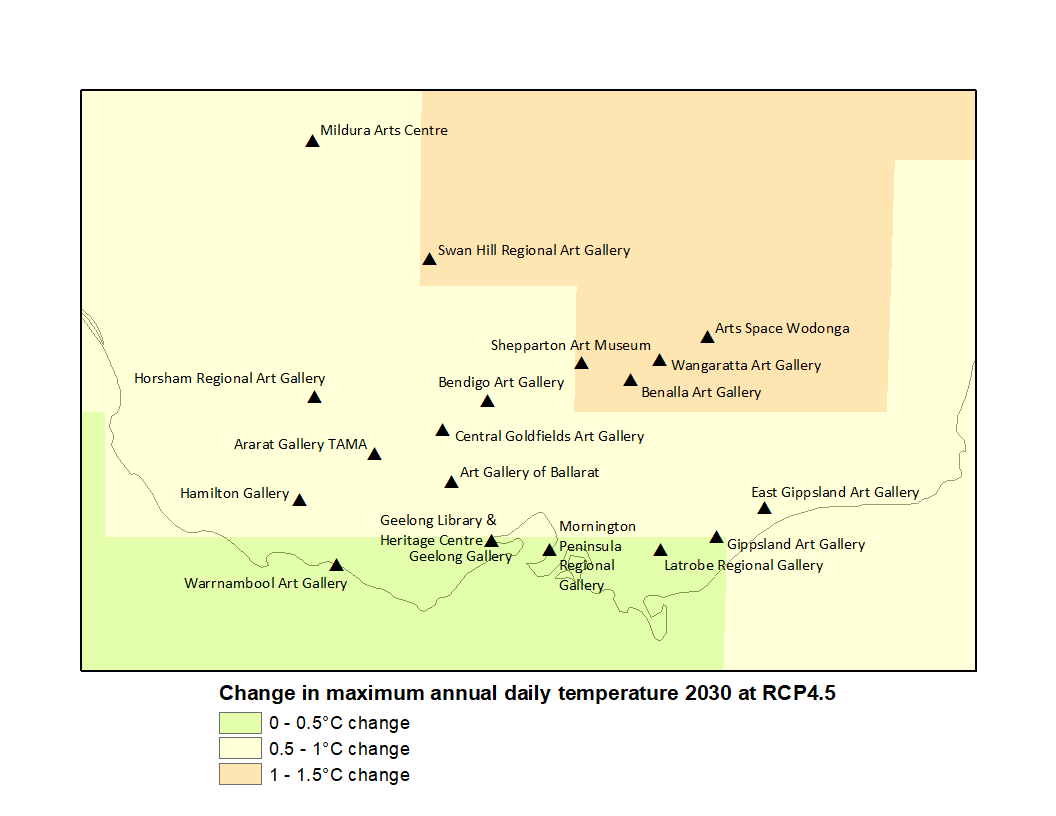
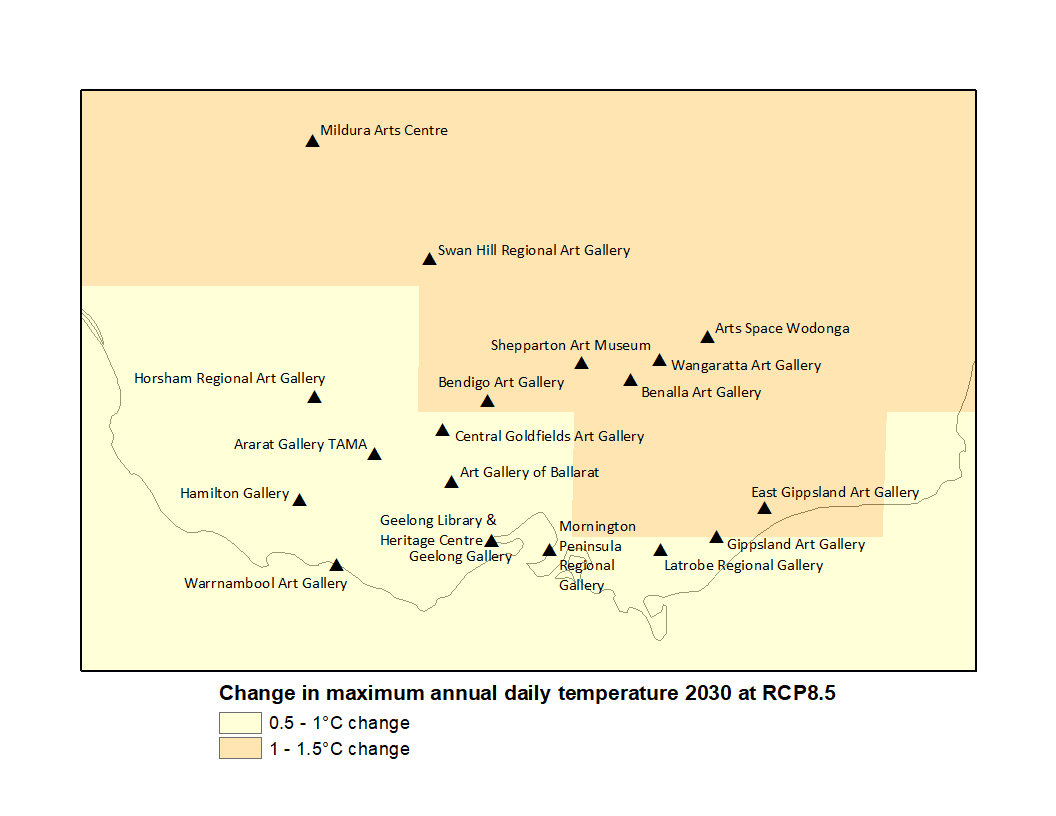
Climate projection data provided by CSIRO and Bureau of Meteorology, Climate Change in Australia website (http://www.climatechangeinaustralia.gov.au/), cited 5 November 2019. Also shown are regional council art galleries in Victoria.
Map V1.1.
Map showing changes to the annual mean surface temperature by the year 2030 under scenario RCP4.5

Map V1.2.
Map showing changes to the annual mean surface temperature by the year 2030 under scenario RCP8.5

Map V2.1.
Map showing changes to the maximum annual daily temperature by the year 2030 under scenario RCP4.5
Map V2.2.
Map showing changes to the maximum annual daily temperature by the year 2030 under scenario RCP8.5
2090 scenarios
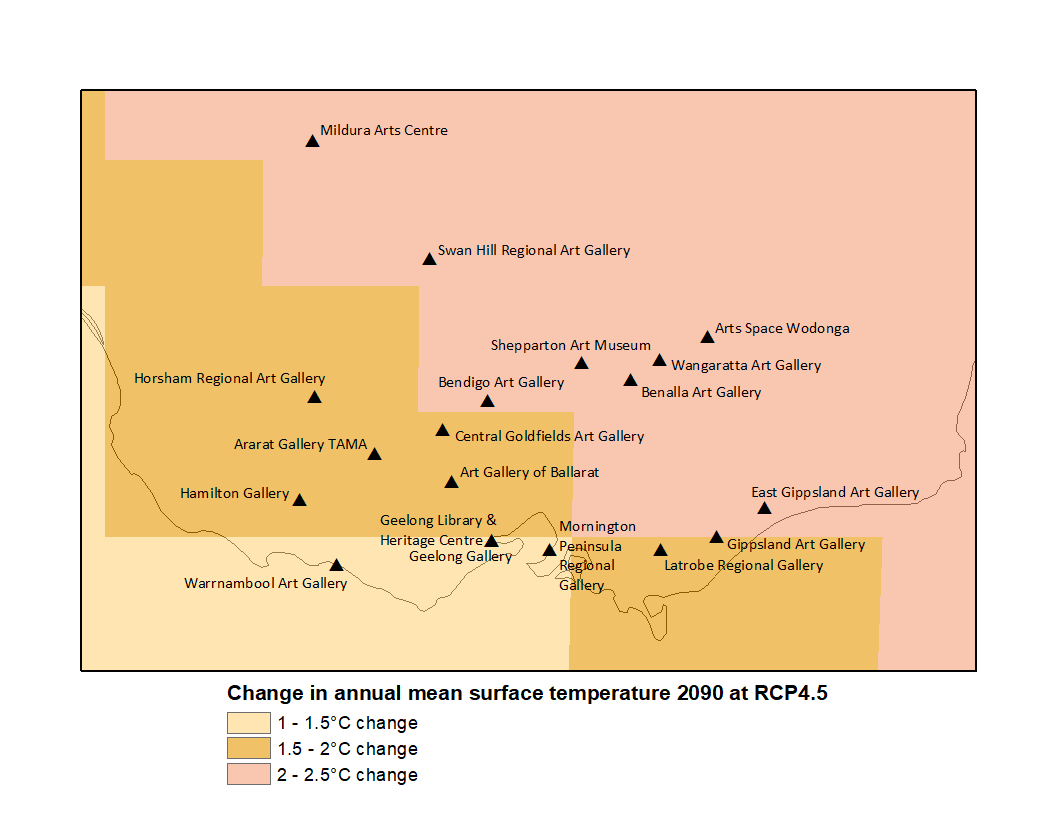
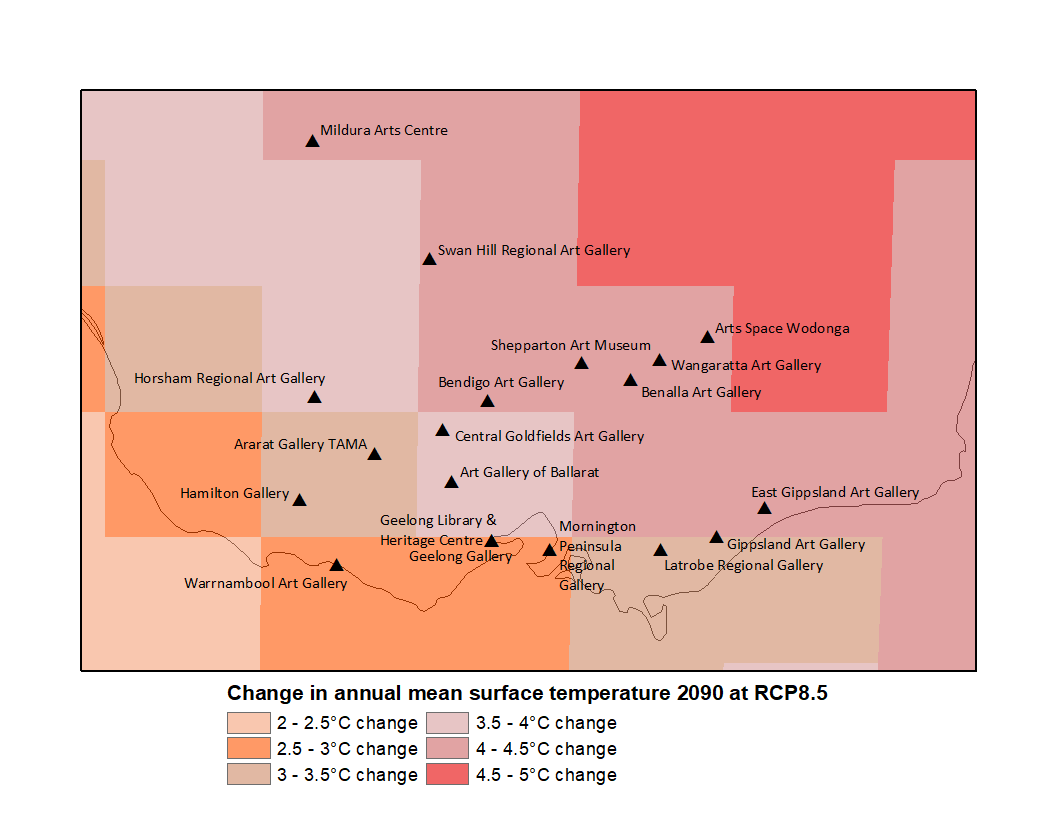
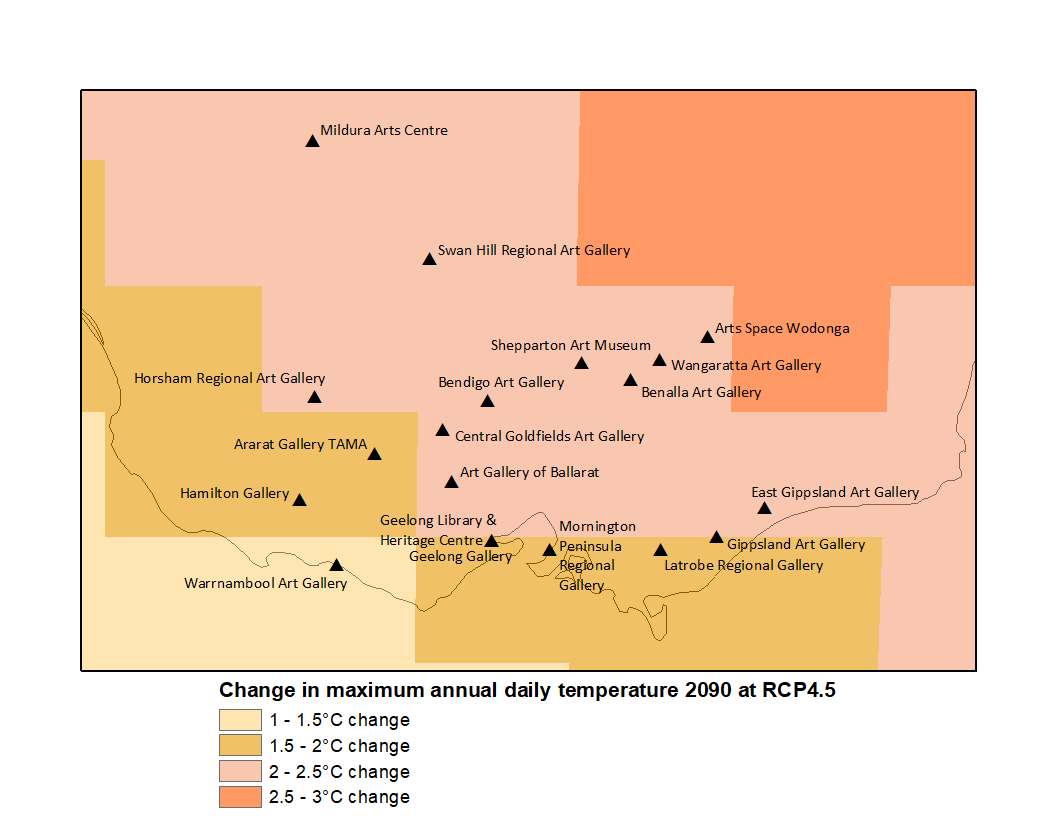
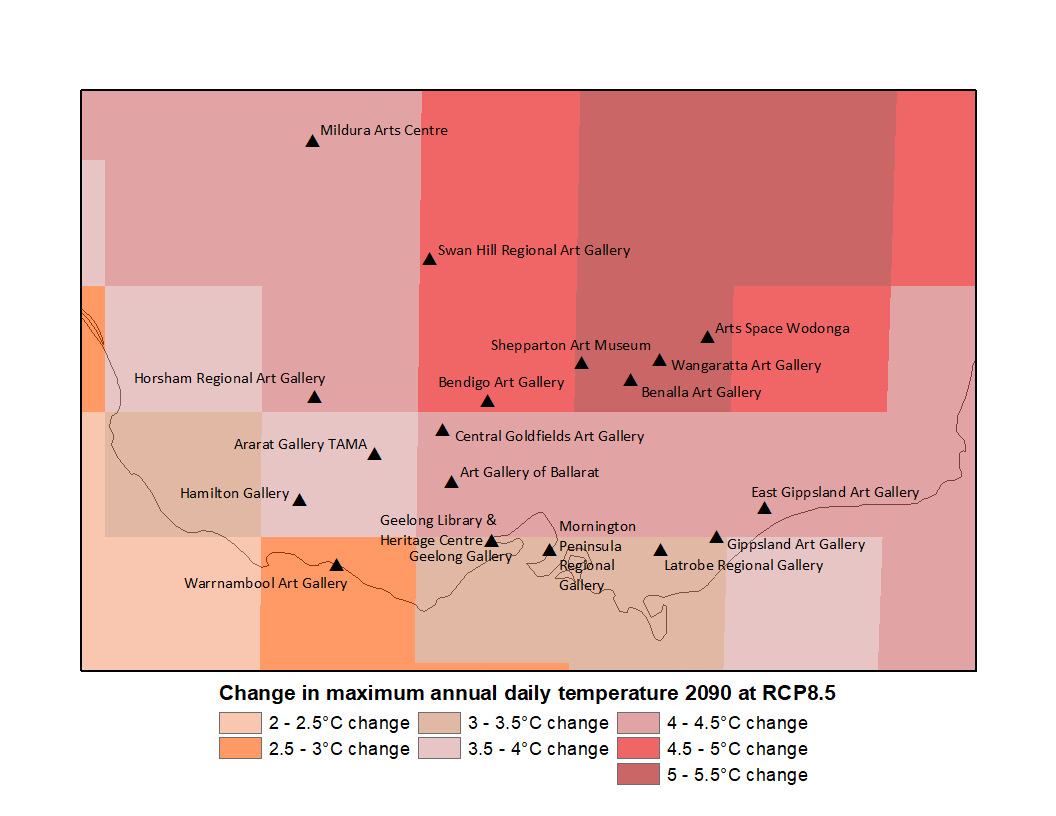
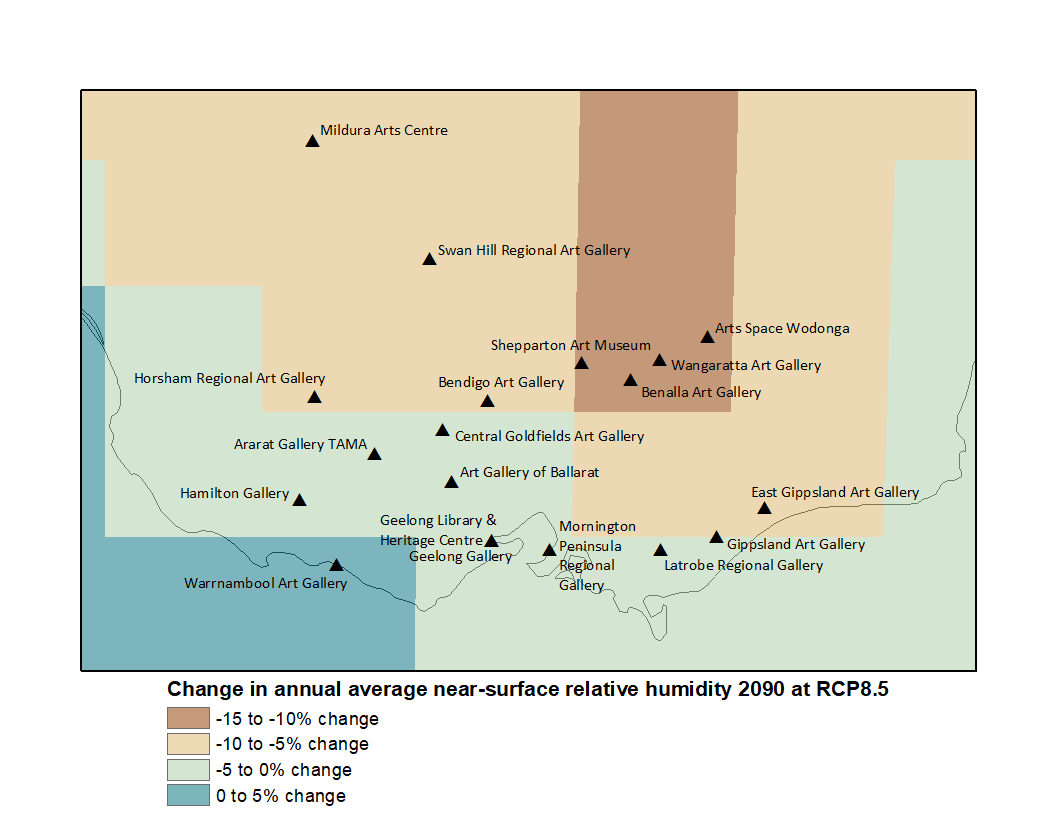
Climate projection data provided by CSIRO and Bureau of Meteorology, Climate Change in Australia website (http://www.climatechangeinaustralia.gov.au/), cited 5 November 2019. Also shown are regional council art galleries in Victoria.
Map V1.5.
Map showing changes to the annual mean surface temperature by the year 2090 under scenario RCP4.5
Map V1.6.
Map showing changes to the annual mean surface temperature by the year 2090 under scenario RCP8.5
Map V2.5.
Map showing changes to the maximum annual daily temperature by the year 2090 under scenario RCP4.5
Map V2.6.
Map showing changes to the maximum annual daily temperature by the year 2090 under scenario RCP8.5
Map V3.5.
Map showing changes to the annual average near-surface relative humidity by the year 2090 under scenario RCP4.5

Map V3.6.
Map showing changes to the annual average near-surface relative humidity by the year 2090 under scenario RCP8.5
WESTERN AUSTRALIA
2030 scenarios
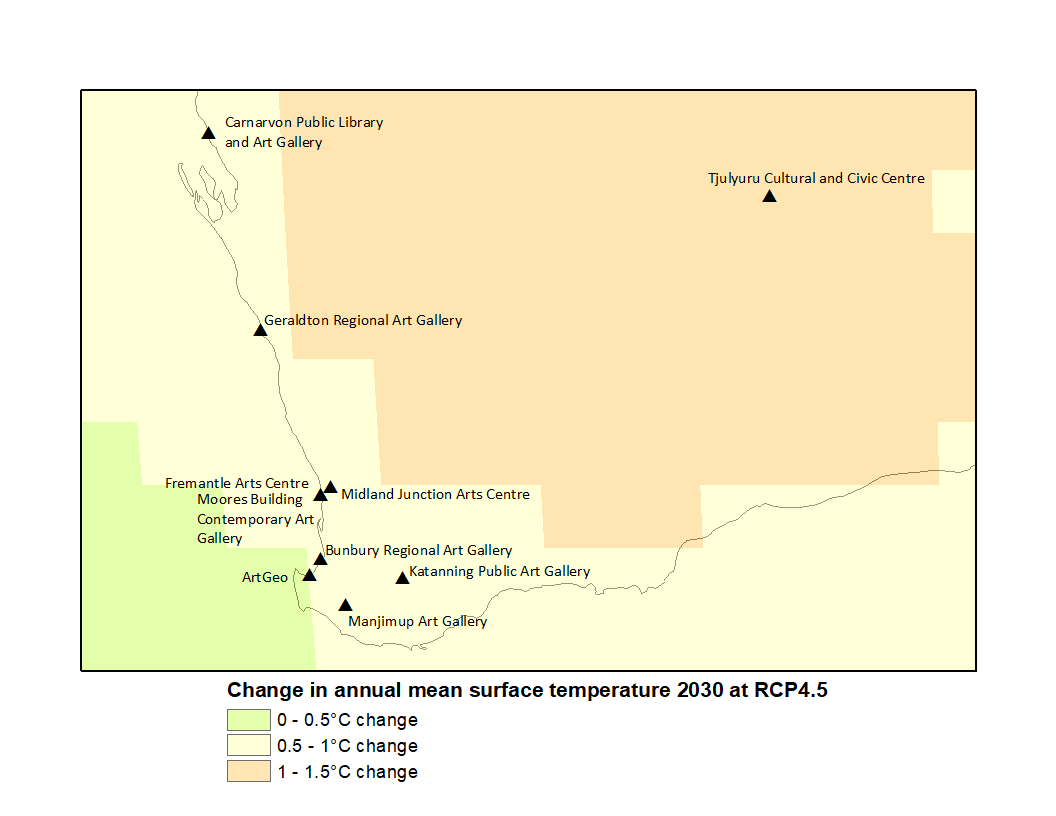
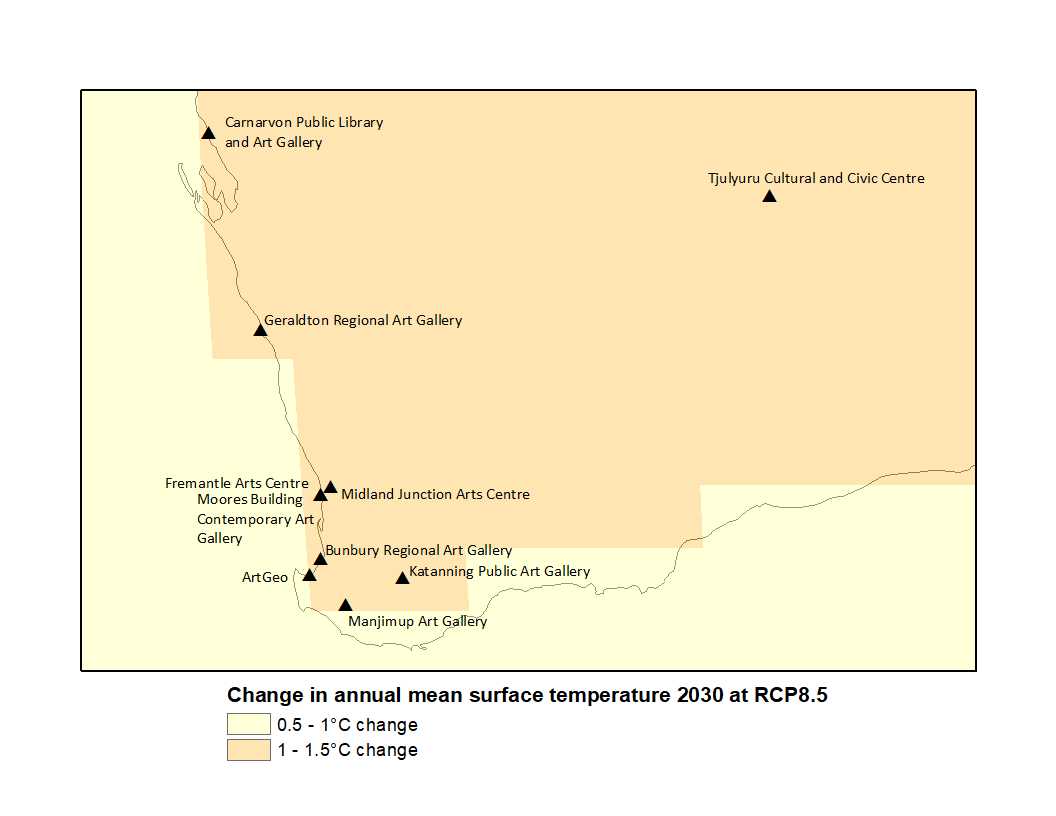
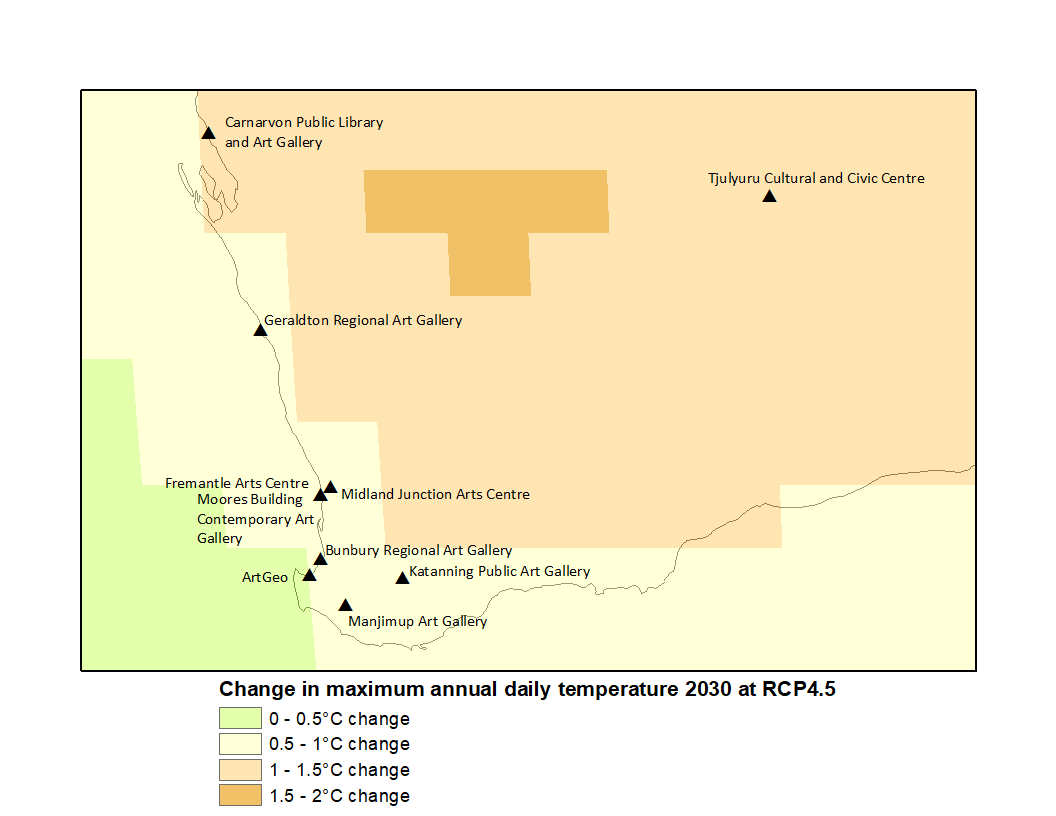
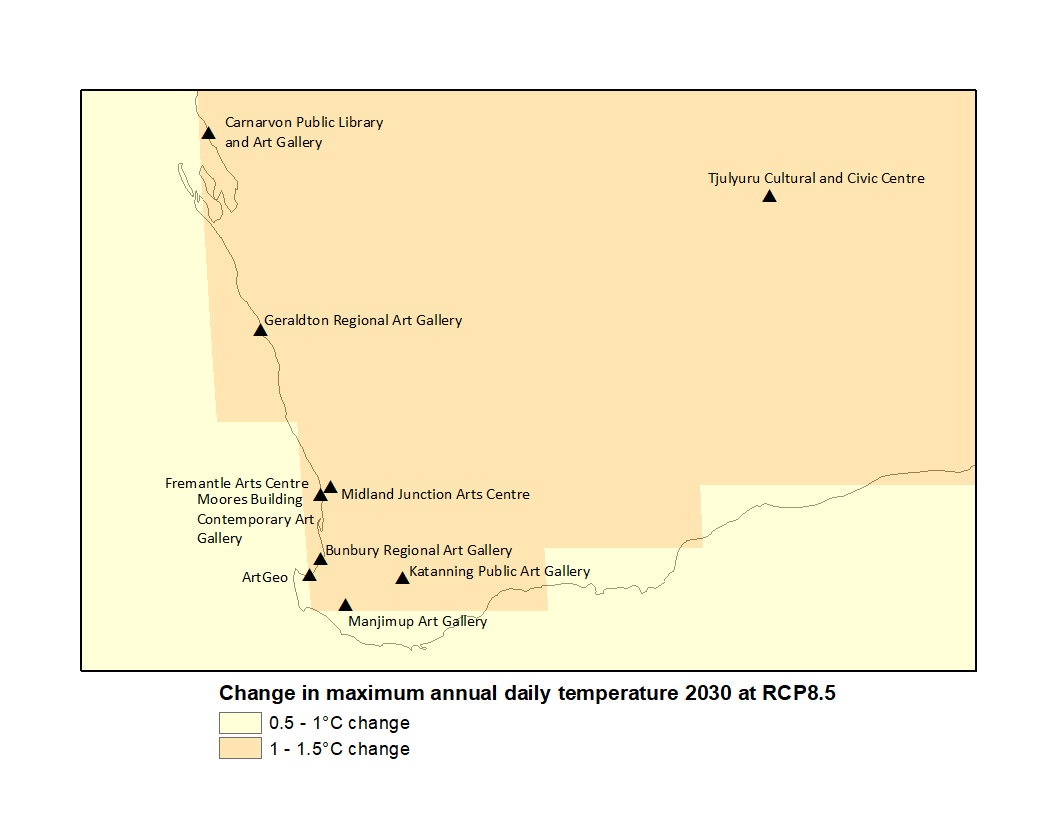
Climate projection data provided by CSIRO and Bureau of Meteorology, Climate Change in Australia website (http://www.climatechangeinaustralia.gov.au/), cited 5 November 2019. Also shown are regional council art galleries in Western Australia.
Map W1.1.
Map showing changes to the annual mean surface temperature by the year 2030 under scenario RCP4.5
Map W1.2.
Map showing changes to the annual mean surface temperature by the year 2030 under scenario RCP8.5
Map W2.1.
Map showing changes to the maximum annual daily temperature by the year 2030 under scenario RCP4.5
Map W2.2.
Map showing changes to the maximum annual daily temperature by the year 2030 under scenario RCP8.5
2090 scenarios
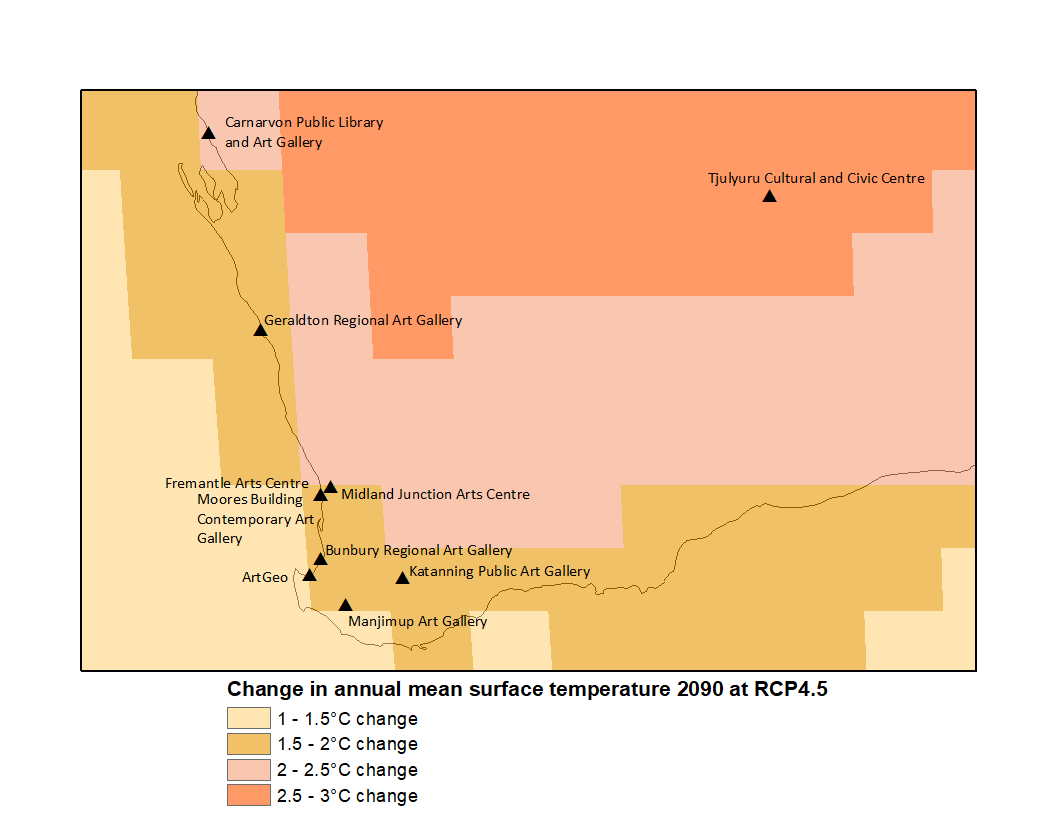
Climate projection data provided by CSIRO and Bureau of Meteorology, Climate Change in Australia website (http://www.climatechangeinaustralia.gov.au/), cited 5 November 2019. Also shown are regional council art galleries in Western Australia.
Map WV1.5.
Map showing changes to the annual mean surface temperature by the year 2090 under scenario RCP4.5
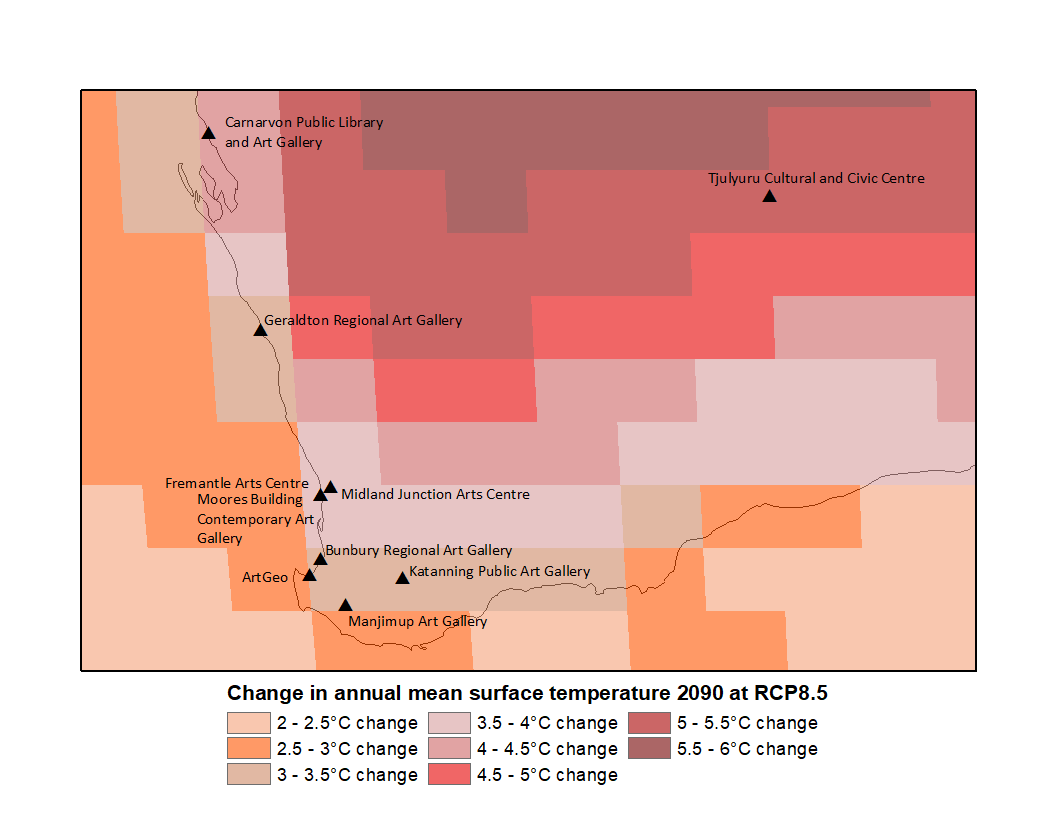
Map W1.6.
Map showing changes to the annual mean surface temperature by the year 2090 under scenario RCP8.5
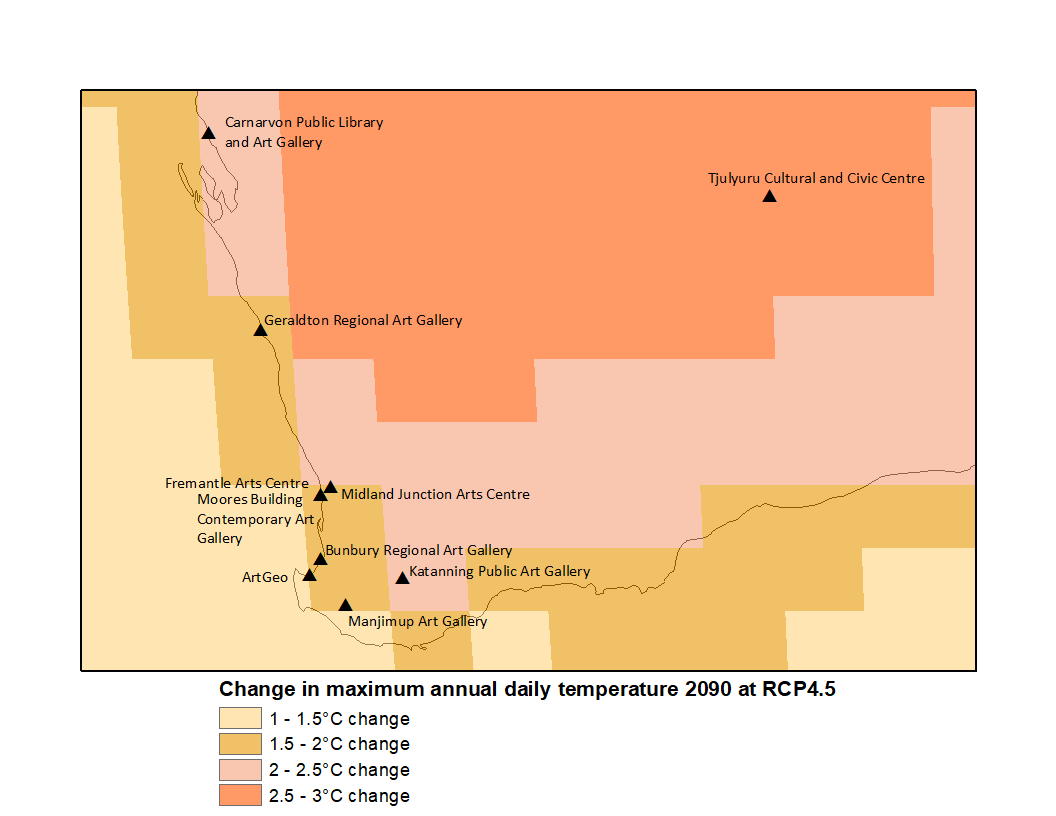
Map W2.5.
Map showing changes to the maximum annual daily temperature by the year 2090 under scenario RCP4.5
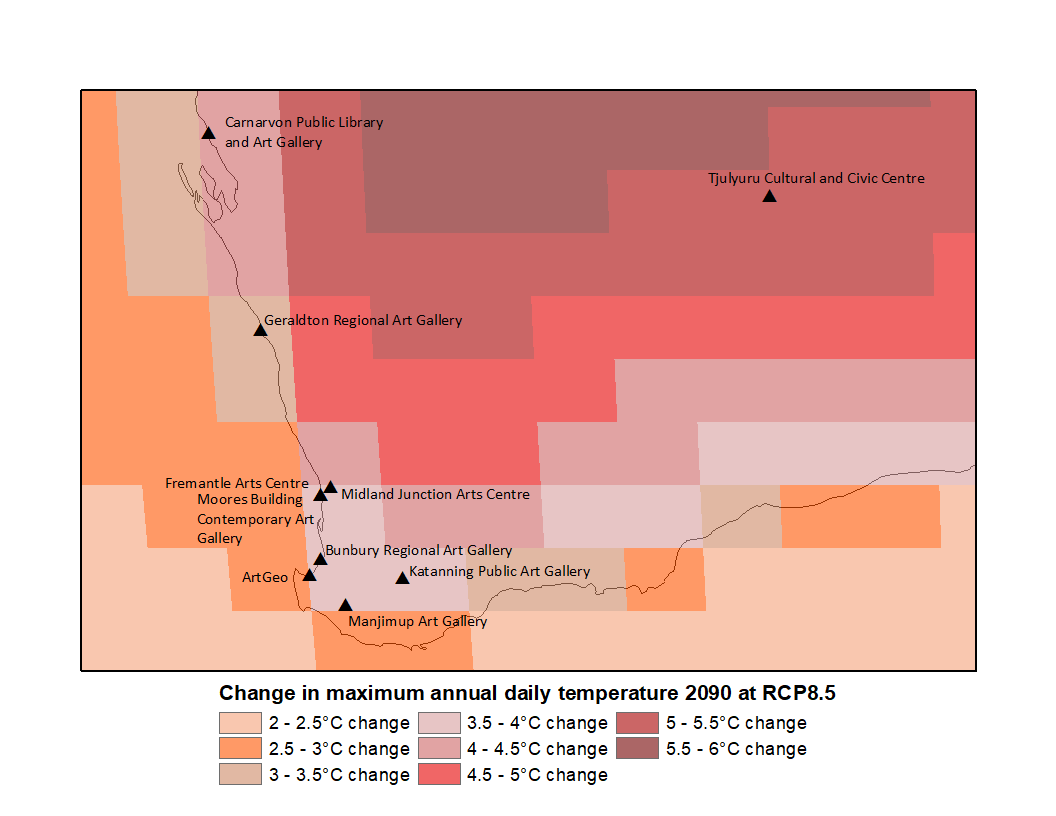
Map W2.6.
Map showing changes to the maximum annual daily temperature by the year 2090 under scenario RCP8.5
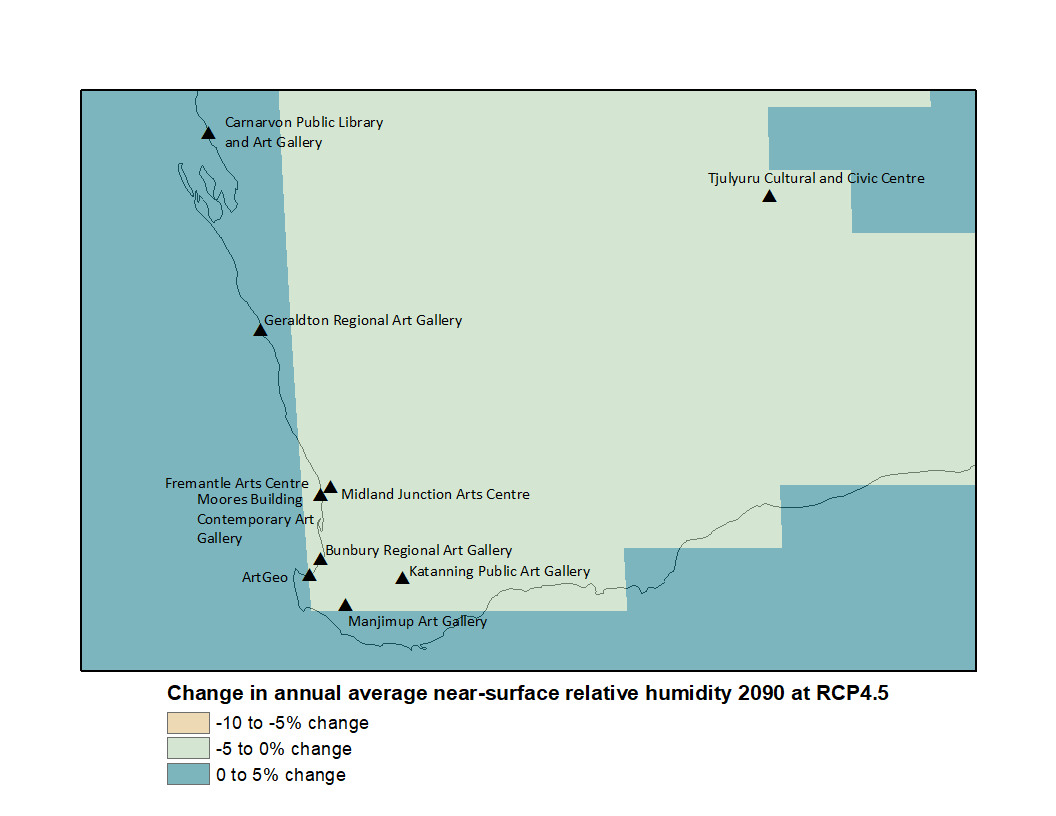
Map W3.5.
Map showing changes to the annual average near-surface relative humidity by the year 2090 under scenario RCP4.5
Map W3.6.
Map showing changes to the annual average near-surface relative humidity by the year 2090 under scenario RCP8.5
